Cost engineering for agentic AI
Token prices fall every year, and agent bills still rise. The unit that matters is cost per successful task. Price per token hides the retries.
In the introduction I set out the framework. Realized value is capability multiplied by four discounts: cost, reliability, safety and controllability. Part 1 covered capability. This second deep dive takes up cost, the one factor with a clean unit, the dollar. It asks two questions. What does an agent cost per successful task? And which levers reduce that cost without losing quality?
My team and I build the tooling layer beneath enterprise agentic AI, so I look at cost from the system side. I group the levers by what they act on, and I give each one the strongest published evidence I could find.
My short answer: the system decides the cost more than the price list does. The model you pick still matters. But the harness, the context, caching, routing, effort settings and service tier decide most of the bill.
- For high-volume and long-running agent work, inference cost often decides what ships. Token list prices have fallen sharply since 2023, yet enterprise AI bills are rising. Agentic workflows use 5 to 30× more tokens per task than chatbots (Gartner, Mar 2026). Gartner expects more than 40% of agentic AI projects to be cancelled by the end of 2027, citing escalating costs, unclear business value and inadequate risk controls (Gartner, Jun 2025).
- The unit that matters is cost per successful task, and price lists misrank it. On Terminal-Bench 4.0 in October 2026, cost per solved task varied about 10× among models scoring above 55%. It ran from about $3 (GPT-6.1 Sol) to about $31 (Gemini 4 Argon). The most expensive model per token was not the most expensive per success, and the cheapest per token was not the cheapest. A preprint comparing eight reasoning models finds the cheaper-listed model costs more in 32% of model pairs, by up to 28×.
- Cost is a system property, and 2026 changed several of its parts. Adaptive effort has replaced fixed thinking budgets, and the effort setting alone moves cost per task by 10× on one model. List prices now move in different directions by vendor, including scheduled increases. Harness engineering is a named discipline, and its return now depends on the model tier. On the Artificial Analysis Intelligence Index, the gap between the best open-weight and the best closed model widened from 3 points on v4 to 12 on v5.
- Order matters as much as choice. I organise 18 levers into five categories, the 5 Cs (CONTROL, COMPACT, CONSTRAIN, COMMODITISE, CALIBRATE), and back each with named published evidence. In my experience, steps 2 to 5 of the order of operations deliver most of the saving, often 50 to 70% at the same quality. Later steps add less. Six open problems remain.
Terminology. I use harness for the production system around the model: system prompts, tools, control flow, memory, error handling, orchestration and the sandbox. This follows Part 1. "Scaffold" appears only in quotes. Cost per successful task is the cost of all runs, including failed ones, divided by the number that succeed. Where I compute it from a public board, I call it cost per solved task, because the board's pass rate stands in for success.
Evidence. Figures were checked on October 31, 2026. Prices come from each provider's own pricing page that day, and several change on announced dates in December and January. Check them again before relying on them. Vals AI does not say how it computes cost per test. Preprints and vendor-reported figures are labelled as such. For each lever I cite a peer-reviewed anchor first, then provider documentation, then a named production case. Where a lever has only benchmark results, or a single source, I say so in that lever.
Where cost comes from
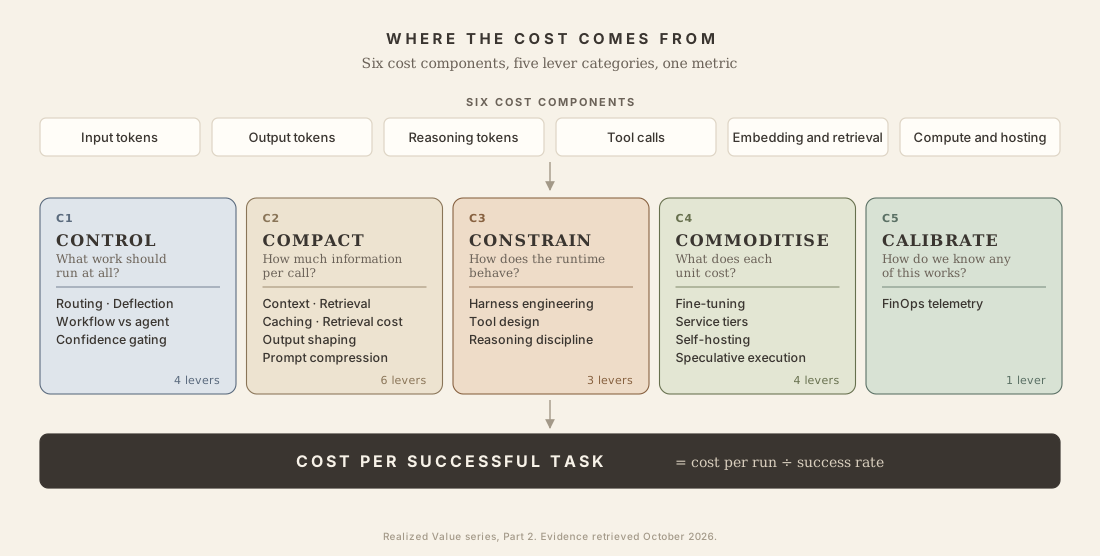
Three claims
Read every price comparison in this article with one caveat. List price does not reliably rank true cost on reasoning models. Chen, Zhang, He, Stoica, Zaharia and Zou (arXiv 2603.23971, revised May 2026, preprint) compare eight reasoning models across twelve tasks. In 32% of model pairs, the model with the lower list price has the higher total cost. The reversals reach 28×. The cause is token use. Models differ widely in how many tokens they spend on the same task, and most of those are reasoning tokens. Terminal-Bench 4.0 shows the same effect at agent scale (see "What cost is" below). Two rules follow for every lever. Route on measured cost per task. And treat that cost as a distribution with a spread.
Claim 1. Cost is a system property. The model is one part of it. The same model can cost several times more or less depending on its harness, context budget, routing policy and effort setting. The effort setting alone moves cost per task 10× on Claude Opus 5.5 (Lever 13). Most teams optimise the wrong layer.
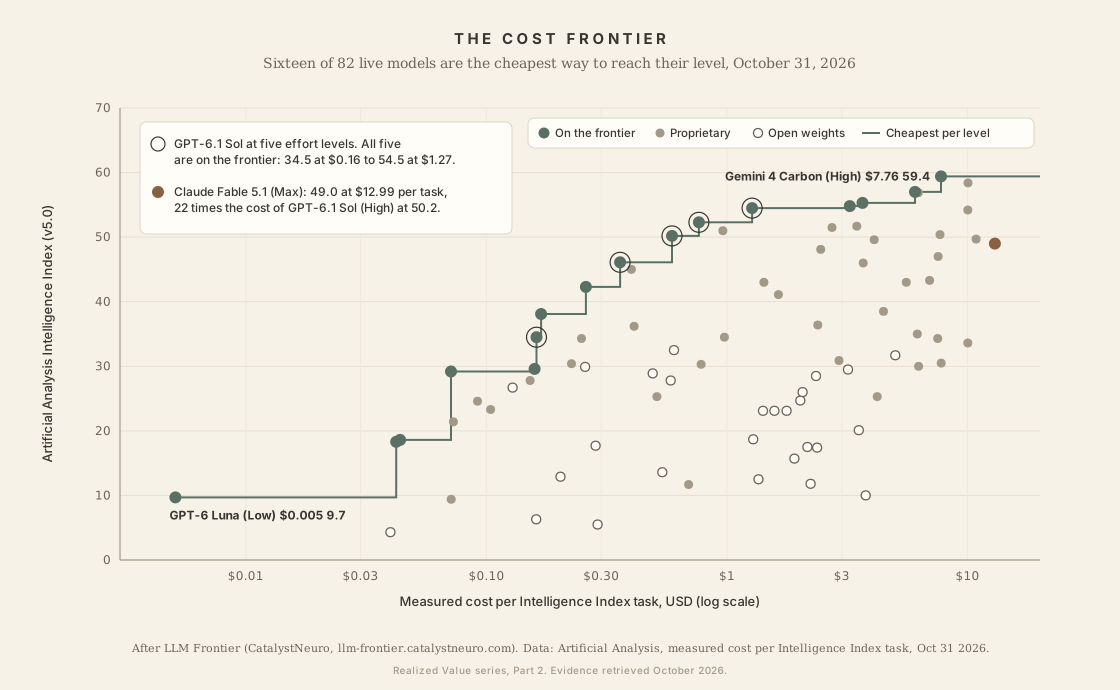
Claim 2. The cheapest model on the Pareto frontier that clears your quality bar usually wins. Across HAL, the Artificial Analysis Intelligence Index and Terminal-Bench 4.0, the top-scoring model is rarely the most cost-efficient. The difference runs to multiples: on Terminal-Bench 4.0, cost per solved task varies about 10× among the models above 55%. Start from the Pareto frontier, and read the ranking second.
LLM Frontier (CatalystNeuro) tracks the cheapest way to reach each level of the Artificial Analysis Intelligence Index, using Artificial Analysis's measured cost per task. On October 31, 2026, 16 of 82 live models sat on that frontier (Figure 2). GPT-6.1 Sol (High) reaches 50.2 for $0.59 per task. Claude Fable 5.1 (Max) scores 49.0 for $12.99, which is 22 times the cost for a lower score. GPT-6.1 Sol is on the frontier at all five of its effort levels, from 34.5 at $0.16 to 54.5 at $1.27. So choosing the effort level is itself a move along the frontier (Lever 13). Two cautions apply. The index measures an evaluation suite, which differs from your agent's tasks. And cost per index task leaves success out of the denominator, so it understates cost per successful task. HAL finds the same pattern on nine agent benchmarks: the most expensive model is on the frontier in only one (Kapoor et al., arXiv 2510.11977, ICLR 2026).
Claim 3. Order matters as much as choice. The order in which you apply the levers decides whether savings multiply or cancel out. In my experience, steps 2 to 5 of the order of operations deliver most of the saving, often 50 to 70% at the same quality. Later steps add less.
Three eras of cost thinking
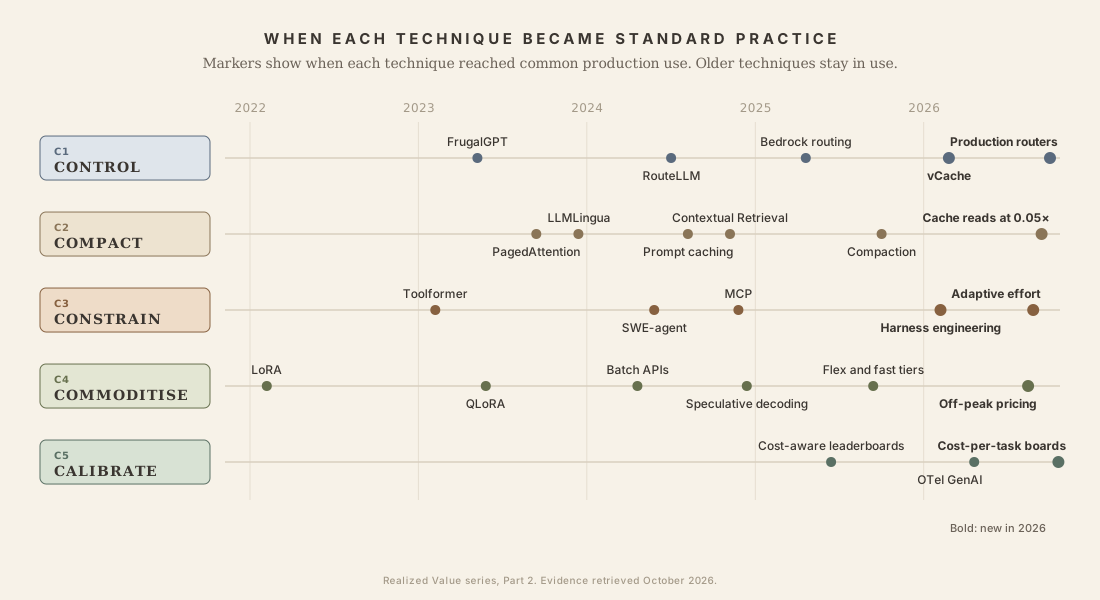
Part 1 traces three eras of capability thinking: prompt, model and system (Part 1, Figure 2). Cost thinking moved through the same three eras. Each era is defined by the unit teams measured.
- 2022 to 2023. Prompt era. Cost meant prompt length per call. Teams trimmed instructions and few-shot examples. Compression tools such as LLMLingua came from this period.
- 2023 to 2024. Model era. Cost meant price per token. The rule was to pick the cheapest model that cleared the quality bar. Enterprise AI pricing was built in this era, and it still prices by model tier.
- 2024 to 2026 and beyond. System era. Cost means cost per successful task, set by the whole system: harness, context, caching, routing, effort settings and tier choice. Price per token is one input among several. The next section shows it no longer ranks models by what a solved task costs.
The earlier units still matter. They no longer decide the bill on their own.
The 5 Cs taxonomy
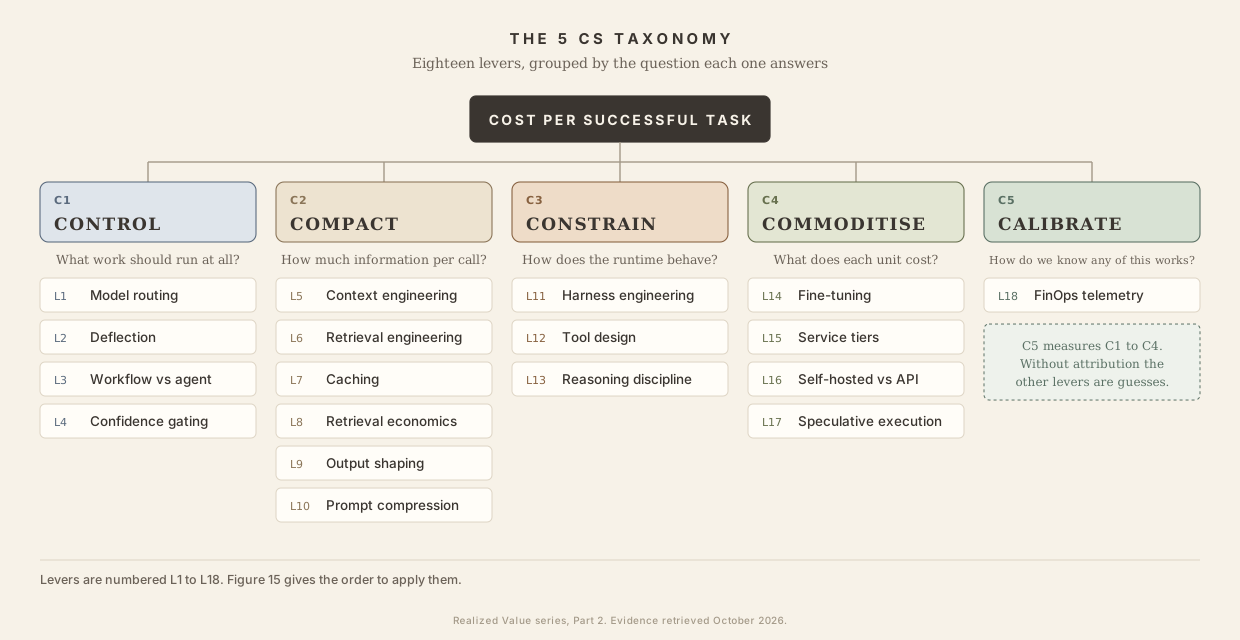
I group the 18 levers into five categories by intent. Each category answers a different question.
| Code | Category | Question it answers | Levers | Indicative savings |
|---|---|---|---|---|
| C1 | CONTROL | What work should run at all? | 1, 2, 3, 4 | 30 to 60% |
| C2 | COMPACT | How much information per call? | 5, 6, 7, 8, 9, 10 | 40 to 80% |
| C3 | CONSTRAIN | How does the runtime behave? | 11, 12, 13 | 15 to 50% |
| C4 | COMMODITISE | What does each unit cost? | 14, 15, 16, 17 | 30 to 95% |
| C5 | CALIBRATE | How do we know any of this works? | 18 | Foundation |
The savings are upper bounds for each category at the same quality. They are not guaranteed to stack. In production, gains combine non-linearly (see "How the levers compound").
The first four categories (C1 to C4) describe how work flows through the system. C5 is the control plane around them. Without per-step cost attribution, none of the other levers can be measured or prioritised. I give cost telemetry its own category because it is a separate concern from reliability telemetry.
What cost is: cost per successful task
Token cost per call says little about what a task costs. I optimise against this:
cost_per_successful_task = cost_per_run ÷ success_rate
Take a model that is 10% cheaper per run but drops success from 90% to 70%. Its cost per successful task rises by about 16% (0.9 ÷ 0.7 = 1.29, against 1 ÷ 0.9 = 1.11), before escalation and rework. Cost per successful task is a measurement discipline before it is an optimisation discipline.
The denominator links cost to reliability. Each failed run is paid for and delivers nothing, so the failures Part 3 measures raise cost per successful task directly.
If you cannot measure cost per step and success rate per cohort, stop and instrument first. Every lever below depends on it.
What the metric shows in October 2026. Vals AI runs every model on Terminal-Bench 4.0 in the same minimal harness. It publishes cost per test next to accuracy (Vals AI, Oct 29, 2026). Dividing cost per test by the pass rate gives an approximate cost per solved task.1
| Model | Pass rate | Cost per test | Cost per solved task |
|---|---|---|---|
| Claude Opus 5.5 | 65.15% | $13.20 | $20.26 |
| Claude Sonnet 5.5 | 64.14% | $16.51 | $25.74 |
| Kimi K3.1 Pro | 63.64% | $4.57 | $7.18 |
| Gemini 4 Carbon | 63.13% | $7.45 | $11.80 |
| GPT-6 Astra | 59.60% | $9.58 | $16.07 |
| Claude Fable 5.1 | 58.08% | $17.18 | $29.58 |
| Gemini 4 Argon | 57.58% | $17.64 | $30.64 |
| GPT-6.1 Sol | 55.05% | $1.72 | $3.12 |
| Claude Opus 5 | 53.53% | $18.60 | $34.75 |
| GPT-6.1 Terra | 49.49% | $2.04 | $4.12 |
| Claude Haiku 5.5 | 36.36% | $3.12 | $8.58 |
| DeepSeek V4.1 Flash 1017 | 31.82% | $0.54 | $1.70 |
| Grok 4.7 | 28.79% | $18.01 | $62.56 |
| Gemini 3.8 Flash | 19.70% | $8.65 | $43.91 |
| GPT-6 Luna | 13.64% | $0.35 | $2.57 |
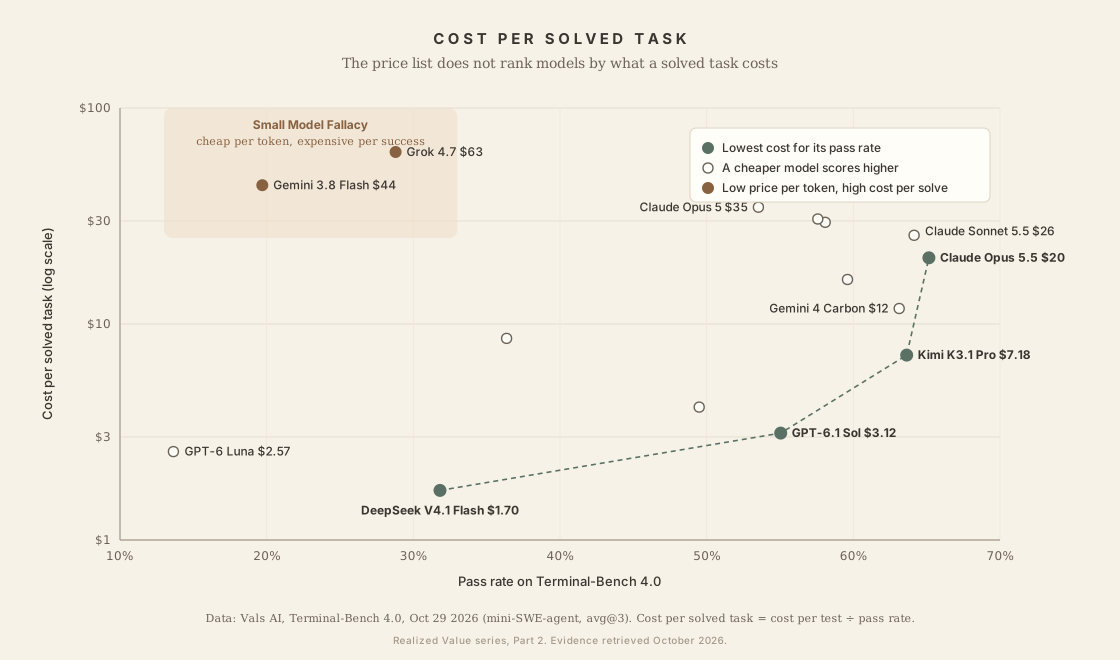
I take four readings from this.
- Among the four models within about two points of the top, cost per solved task ranges from $7 to $26. Kimi K3.1 Pro sits 1.5 points behind Claude Opus 5.5 at about a third of the cost.
- A low price per token can mean a high cost per success. Gemini 3.8 Flash has one of the lowest list prices on the board. It costs about $44 per solved task, more than twice Opus 5.5. Grok 4.7 costs about $63.
- A newer flagship can be cheaper as well as better. Opus 5.5 scores 11.6 points above Opus 5 and costs less per solved task ($20 against $35).
- The cheapest route to a pass sits in the middle of the board. GPT-6.1 Sol solves a task for about $3 at a 55% pass rate.
Three cautions apply. First, Vals does not state which prices or cache discounts it applies. Treat the dollar figures as comparable with each other. Your bill will differ. Second, the runs have no step or cost limit, which a production harness would impose. Third, cost per solved task here includes the cost of failed attempts, which is what you pay. But it assumes you can tell a pass from a failure. The levers below take up the decisions these numbers drive: Lever 3 for the Frontier Trap, Lever 13 for effort and Lever 16 for open weights.
Where cost accumulates in an agent run
Every run breaks down into six components. Each has its own driver and its own levers.

Take an HR leave agent as a worked example. One request uses about 7,000 input and 1,300 output tokens, two to three tool calls and one to two retrieval queries. Multi-agent systems use up to 15× more tokens than simple chat (Anthropic, Multi-Agent Research System engineering post, 2025). Tool results alone can use tens of thousands of tokens before the agent processes a user request.
The eighteen levers
I group the levers by the 5 Cs. Each lever keeps one number throughout, and the C-code under each heading (for example C2.3) marks its category. Cross-references in this article use the lever numbers.
C1. CONTROL
What work should run at all?
Lever 1. Model routing
C1.1. Route each step to its own tier.
Evidence: Peer-reviewed (RouteLLM, ICLR 2025: 95% of GPT-4 quality at 26% strong-model calls). Provider primary (AWS Bedrock Intelligent Prompt Routing: 63.6% average cost saving at baseline accuracy, self-reported). Production (Uber GenAI Gateway; Cloudflare, 10.57B tokens/day).
Assign a model tier to each step of the agent. Classification and extraction go to a small model. Eligibility checks, judgement and drafting go to a large one. The published results:
- RouteLLM (UC Berkeley and Anyscale, ICLR 2025). A matrix-factorisation router reached 95% of GPT-4 quality with only 26% of calls going to the strong model (about 48% cost reduction). With augmented training data, only 14% of calls went to the strong model, 75% cheaper than a random baseline. Cost fell by more than 85% on MT-Bench, 45% on MMLU and 35% on GSM8K (LMSYS, Jul 2024; arXiv 2406.18665).
- AWS Bedrock Intelligent Prompt Routing (GA April 22, 2025). AWS's own tests on RAG datasets show 63.6% average cost savings, with 87% of prompts routed to Claude 3.5 Haiku (self-reported; AWS, 2025).
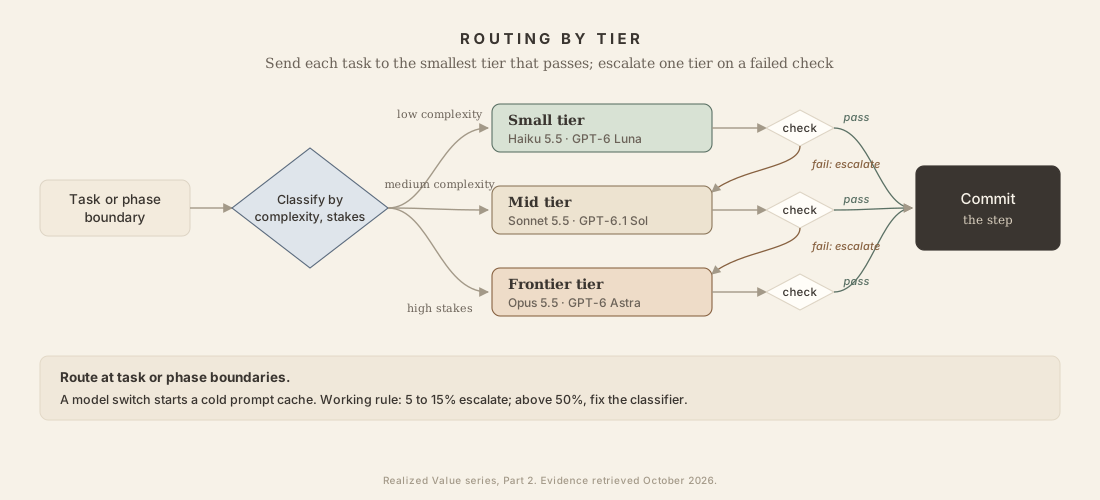
How much routing can be worth. Vals AI estimates that an oracle router would beat the best single model on the Vals Index by 14 points at about 40% lower cost (Vals AI, Oct 14, 2026). An oracle router picks the best model for each task in hindsight. No real router reaches it, so I read the figure as an upper bound. The price ladder sets the other bound. Claude Haiku 5.5 costs 2.5% of Claude Opus 5.5 per token for prompts up to 100,000 tokens. A step moved down that ladder saves up to 97.5%. Above 100,000 tokens, Haiku 5.5 costs five times more, and the saving falls to 87.5% (Anthropic, Haiku 5.5). Long agent trajectories cross that line.
Switching models mid-session has a cost. A new model starts with a cold prompt cache. Vals says it plainly: in long-running sessions, switching to a cheaper model does not automatically bring cost savings. Route at task or phase boundaries, where the cache would be rebuilt anyway. Measure the cache-miss cost before routing step by step.
My working rule is an escalation rate of 5 to 15%. If half or more escalates, the routing is wrong. A common mistake is to "use the small model everywhere". The goal is the smallest acceptable model for each step, with a known escalation path.
Lever 2. Deflection
C1.2. Answer without calling the model.
Evidence: Peer-reviewed (vCache, ICLR 2026: up to 12.5× higher hit rate than GPTCache baselines while holding a user-specified error bound; 57% hit rate at under 0.5% error in one configuration). Provider primary (Azure API Management llm-semantic-cache-lookup policy, preview; AWS ElastiCache semantic cache: up to 86% cost reduction at 91% answer accuracy on 63,796 queries). Production (Walmart: waLLMartCache, ICPR 2024, a distributed multi-tenant cache; hit rate in the table below).
A rule-based layer in front of the model, a small classifier or a response cache can answer a request without calling the model at all. One distinction matters here.
Routing decides which model answers. Deflection decides whether any model answers.
This changes the arithmetic. Routing brings the cost down to the cheap model's price and stops there. When 87% of prompts go to the small model, you still pay the small model on all 87%. Deflection removes the call. A cache hit costs one embedding and one vector lookup, roughly a thousandth of a generation call. A 40% deflection rate removes 40% of inference cost.
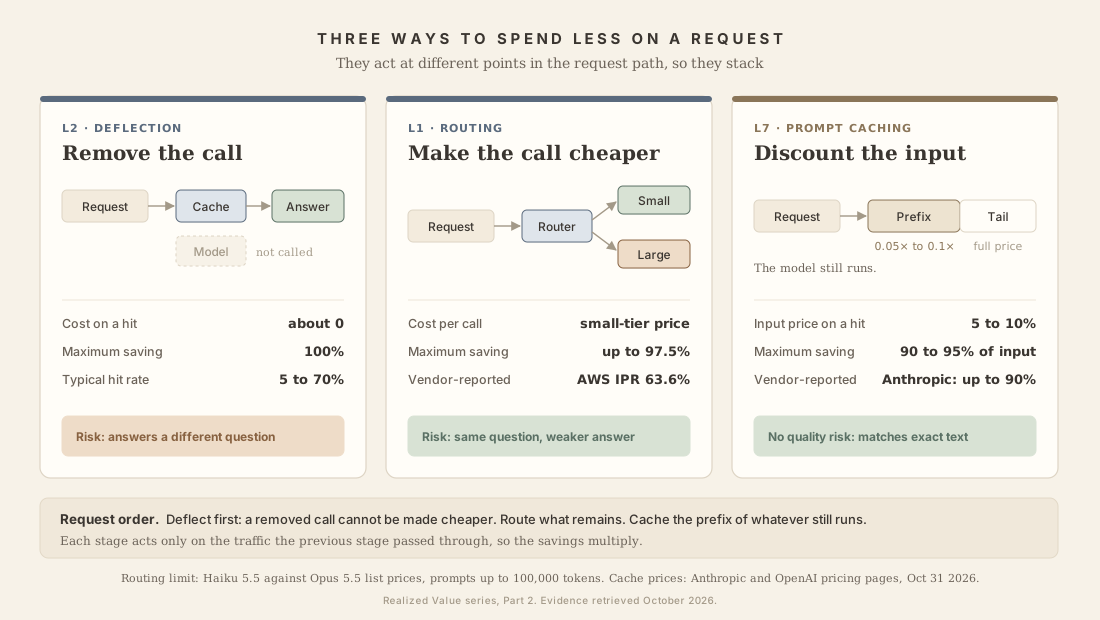
In the request path, the order is as follows.
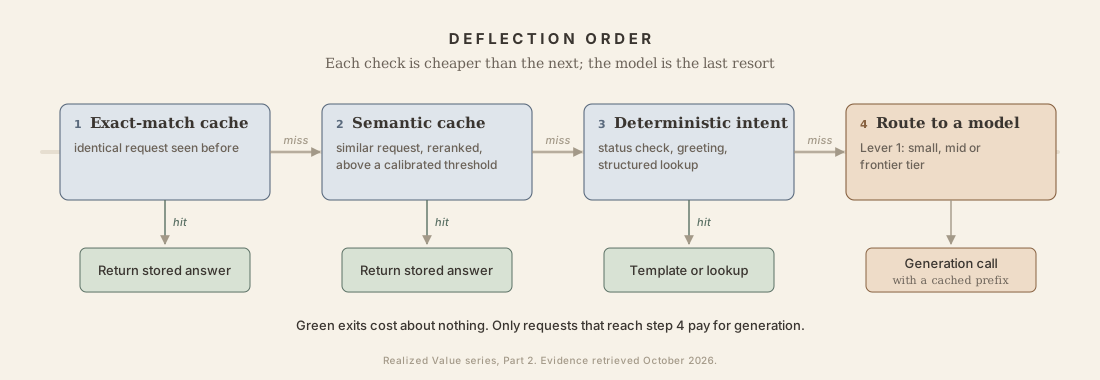
Realistic deflection rates depend on the workload. The "90%+ hit rate" in vendor material mixes up two things. One is how accurate a match is once a hit occurs. The other is how often hits occur. The published production and benchmark numbers:
| Workload | Realistic rate | Source |
|---|---|---|
| Repetitive query sets (benchmark) | 62–69% | GPT Semantic Cache (arXiv 2411.05276): 61.6–68.8% |
| Code and other high-repetition categories | 40–60% | Category-aware caching (arXiv 2510.26835) |
| E-commerce search (Walmart) | About 50% | Portkey's summary of a talk by Rohit Chatter, Walmart Global Tech |
| Predictive instruction cache, first turn | 20–51% | InstCache (arXiv 2411.13820): 51.3% on LMSys |
| Open-ended conversational chat | 5–15% | Category-aware caching |
| Agentic tool loops | Highly variable | Cortex (arXiv 2509.17360) |
The hit rate follows how often queries repeat. Traffic where a few queries dominate (a power law) caches well. Uniform or volatile traffic does not. Exact repeats alone are a large share of real traffic. That is why a cheap exact-match layer belongs in front of the semantic one.
Check the economics first. A remote vector lookup takes roughly 30 ms. At that latency, a semantic cache needs a hit rate of around 15 to 20% to break even (arXiv 2510.26835). The same paper puts the break-even for in-memory HNSW search at 3 to 5% in its abstract, and its worked examples come out lower. Measure how often your queries repeat before you build.
This lever fails differently from the others. When routing misfires, a cheaper model answers your actual question slightly worse. Quality degrades gradually. When deflection misfires, the system returns an answer computed for a different question, with full confidence. A hit across tenants is a privacy breach.
The published mitigations agree on five points:
- an exact-match first layer (L1) before the semantic layer (L2)
- strict namespacing per tenant and per user
- cross-encoder reranking of the top-K candidates before a match is accepted
- expiry (TTL) plus invalidation when the source version changes
- thresholds calibrated per prompt
Never cache personalised, time-sensitive or high-stakes responses. A semantic cache returns a stored answer for a similar request, so that answer can be wrong, out of date or unsafe for the request in hand.
Set the similarity threshold with your risk owners, and treat it as a risk control.
Lever 3. Workflow or agent
C1.3. This choice comes before every other lever.
Evidence: Peer-reviewed (HAL, ICLR 2026, arXiv 2510.11977: harness choice moves the cost-accuracy Pareto position). Provider primary (Anthropic, "Building effective agents"). Benchmark (Hugging Face smolagents: 30% fewer steps, so 30% fewer LLM calls). No production case.
If the task has low cognitive complexity and a stable structure, a deterministic workflow with one LLM call beats an agent loop. Anthropic's engineering essay "Building effective agents" (Dec 2024) draws this distinction. It recommends starting with the simplest workflow that fits.
The Frontier Trap. Part 1 gives it this name: defaulting to the most expensive frontier model for every task. It is the same mistake as building an agent where a workflow fits, one level down. The October 2026 data shows what it costs. On the official Terminal-Bench 4.0 board, GPT-6.1 Sol (in Codex) ties GPT-6 Astra at 58.2%. A full run costs $0.6k against $3.3k (Terminal-Bench 4.0 leaderboard). On Artificial Analysis's Intelligence Index v5, GPT-6.1 Sol scores within 4 points of Claude Opus 5.5 at about an eighth of the cost per task (Artificial Analysis, Oct 27, 2026).
The Small Model Fallacy is the inverse. A model that is cheap per token can be expensive per success. It may fail often, or spend many tokens to finish. Gemini 3.8 Flash is the example on Terminal-Bench 4.0 (see "What cost is"). On the official board, Claude Sonnet 5.5 at max effort cost $7.3k for a full run against $4.7k for Opus 5.5, with a lower score. It used 19.4 billion tokens against 8.0 billion. The rule is the same in both directions. Choose by cost per successful task on your own workload.

Lever 4. Confidence-gated work
C1.4. Pay for extra checks only when a cheap signal asks for them.
Evidence: Peer-reviewed (FrugalGPT, Chen, Zaharia and Zou, TMLR: matches GPT-4 at up to 98% lower cost). Preprint (UCCI, arXiv 2605.18796: 31% lower normalised inference cost than a large-model-only baseline, calibration error 0.12 to 0.03). Provider primary (AWS Bedrock IPR escalation). Production, with a different mechanism (Cloudflare AI code review: rule-based risk tiers, $0.20 against $1.68 per review, per ZenML's summary of Cloudflare's post). See the caveat on the mechanism.
Running a critic on every output doubles the cost. Running it on the 10% with low confidence costs a tenth as much, and catches most errors when the confidence signal is well calibrated. This is Lever 1's escalation, applied more widely. Pay for verification, expansion or a larger-model pass only when a cheap signal calls for it.
Evidence caveat. Production data on the cost effect of confidence gating is scarce. The pattern appears in the escalation tiers of routing frameworks (RouteLLM, Bedrock IPR). It also appears in outcome-based pricing (for example, per-resolution pricing for customer-service agents). But no named deployment has published a measured cost change from confidence gating alone. I read the savings range as showing the direction of the effect only.
C2. COMPACT
How much information per call?
Lever 5. Context engineering
C2.1. Put only what each step needs into the prompt.
Evidence: Peer-reviewed (AgentDiet, FSE 2026: 40-60% input-token cut at unchanged pass rate; MemGPT, arXiv 2310.08560). Provider primary (Anthropic, "Effective context engineering for AI agents"). Production (Manus: input-to-output token ratio around 100:1, Manus, Jul 2025). Benchmark (OpenHands condensation: under half the per-turn cost, with 54% of a SWE-bench Verified subset solved against 53%, OpenHands, Apr 2025).
Anthropic's engineering guide from September 2025 is now the standard reference: "Effective context engineering for AI agents". Practitioners moved from prompt engineering to context engineering because they traced most production agent failures to the context the model was given.
2026 anchor: trajectory accumulation is the largest agent cost driver, and most of it can be removed. AgentDiet (PACMSE FSE 2026, arXiv 2509.23586) reports a 39.9 to 59.7% cut in input tokens and a 21.1 to 35.9% cut in total cost. Quality did not drop. That held across two LLMs and two coding benchmarks. The paper adds OpenRouter telemetry. Of Claude 4 Sonnet's roughly 100B daily tokens, 99% were trajectory input and 1% was generated output. In any non-trivial agent run, the largest cost line is the conversation history that builds up across steps. The answer the model produces is a small share.
The tactics that work in practice:
- Per-step context budgets (for example: intake up to 2k tokens, retrieval up to 4k, eligibility up to 6k, response up to 3k)
- Prompt order for cache hits: stable system prompt, then tool schemas, then semi-stable policy, then the dynamic user and conversation content
- Compaction: replace verbose history with structured decisions and pointers to evidence
- Step-scoped injection: each step sees only what it needs
- Tool-selection budget: keep the three to five most-used tools loaded, and switch to dynamic discovery beyond ten (Anthropic, Sep 2025)
Lever 6. Data quality and retrieval engineering
C2.2. Good retrieval keeps the context small.
Evidence: Peer-reviewed (PLAID, Santhanam et al., CIKM 2022; BrowseComp-Plus, arXiv 2508.06600). Provider primary (Anthropic Contextual Retrieval: retrieval-failure rate down 49%, 67% with reranking). Evaluation (Sourcegraph, long context against RAG). No production case.
Bad retrieval forces a larger context, a higher top_k, more reasoning to disambiguate, and more retries.
The benchmark to beat is Anthropic's Contextual Retrieval (Sep 2024). It reduces the top-20-chunk retrieval failure rate by:
- 35% with contextual embeddings alone (5.7% to 3.7%)
- 49% with contextual embeddings and contextual BM25 (5.7% to 2.9%)
- 67% when combined with reranking (5.7% to 1.9%)
Source: Anthropic. Introducing Contextual Retrieval. Anthropic puts the one-time cost of generating the contextualised chunks at about $1.02 per million document tokens, with prompt caching.
Lever 7. Caching
C2.3. In my reading, the lever with the largest single effect.
Evidence: Peer-reviewed (PagedAttention, SOSP 2023; SGLang RadixAttention, NeurIPS 2024, up to 6.4× throughput on prefix-sharing; Prompt Cache, MLSys 2024). Provider primary (Anthropic: up to 90% cost and 85% latency reduction). Named customer (Notion, Simon Last). Production (ProjectDiscovery, 59% cost cut).
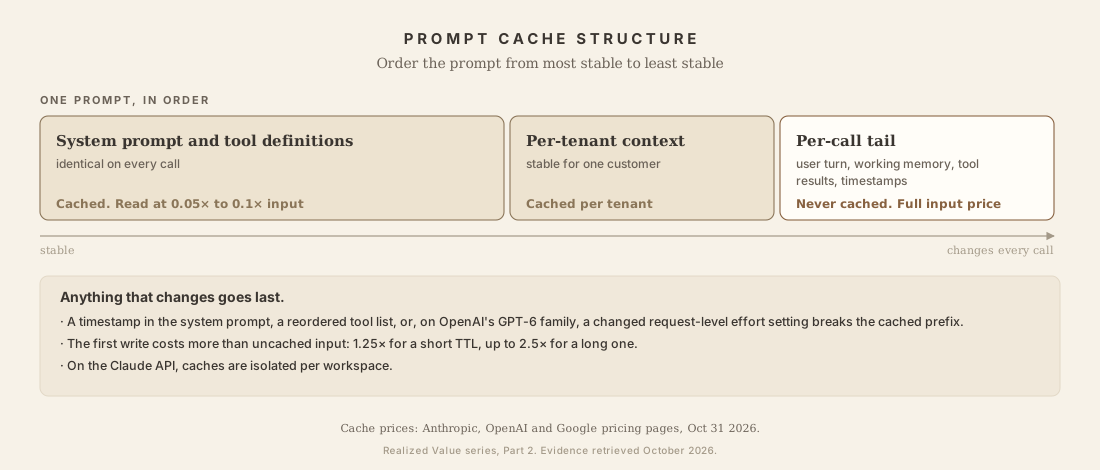
Prompt and prefix caching (at the provider):
- Anthropic. Cache reads cost 0.05× base input on Opus 5.5 and Sonnet 5.5 (95% savings), and 0.1× on Haiku 5.5 and Fable 5.1. Writes with a 5-minute expiry cost 1.25×, and 1-hour writes cost 2× (Anthropic, Opus 5.5).
- OpenAI. Cached input costs 0.05× on GPT-6.1 Sol and Terra and 0.1× on GPT-6 Astra. Writes with a 30-minute expiry cost 1.25×, and 12-hour writes cost 2.5× (OpenAI pricing).
- Google. Cached input on Gemini 4 Argon costs 0.05× input during introductory pricing (Gemini API pricing).
- Latency. Anthropic reports latency reductions of up to 85% for long prompts with Claude prompt caching (Anthropic, Aug 2024).
- Named customer. Notion AI is Anthropic's named customer for prompt caching. Simon Last (Notion co-founder) is quoted on Anthropic's announcement page on the cost and latency benefit (Anthropic, 2024).
- Production report. ProjectDiscovery cut LLM costs by 59% with prompt caching. It raised its cache-hit rate from 7% to 74% by moving content within the prompt (ProjectDiscovery, Apr 2026).
Semantic caching belongs to Lever 2. The distinction is worth keeping. Prompt caching and KV reuse make a call that still happens cheaper. Semantic caching stops the call from happening. The mechanism, the limit on savings and the failure mode all differ.
Five caches, each with its own invalidation rule:
| Cache type | What it stores | Invalidation trigger | TTL guidance |
|---|---|---|---|
| Prompt/prefix | System prompts, tool schemas | Prompt version change | 5 min to 1 hr |
| Semantic | Query to response | Policy or corpus update | Hours to days |
| Embedding | Chunk to vector | Source change | Until source changes |
| Tool result | Stable lookups (holidays, org chart) | Source system update | Hours to days |
| Session | Parsed context, extracted fields | Session end | Session duration |
Caching without invalidation rules ships stale answers. Track the cache hit rate and the stale-serve rate.
Order the prompt for cache hits. ProjectDiscovery's biggest gain, the jump in hit rate above, came from moving dynamic content (working memory, runtime context) out of the cacheable prefix.
Three changes to cache arithmetic in 2026:
Cache reads got cheaper again in September 2026. Cache reads now cost 0.05× the input price on Claude Opus 5.5 ($0.20 against $4), on Sonnet 5.5, and on GPT-6.1 Sol ($0.10 against $2). Haiku 5.5, Fable 5.1 and GPT-6 Astra stay at about 0.1×. Gemini 4 Argon's cached input is 0.05× during its introductory pricing. DeepSeek's cache hits cost 2% of a miss (Anthropic; OpenAI; Google; DeepSeek). Cache writes still cost more than uncached input: 1.25× for a short expiry at both Anthropic and OpenAI. On OpenAI's GPT-6 family, changing the reasoning effort on the request breaks the cached prefix. The
configuration_updateinput item changes effort mid-conversation without breaking it (OpenAI, GPT-6.1 Sol guide).Anthropic isolates caches per workspace (effective Feb 5, 2026). Prompt caches are now isolated per workspace on the Claude API, Claude Platform on AWS, and Microsoft Foundry (beta). Bedrock and Vertex AI remain isolated per organisation (Claude API Docs, 2026). Teams with several workspaces need to revisit their cache strategy. A shared prompt that hit 90% across workspaces now misses entirely across workspace boundaries.
The Opus 4.7 tokeniser produces more tokens for the same text. Anthropic's migration guide, as reported by The Decoder, puts the increase at 1.0 to 1.35× against Opus 4.6. I could not open Anthropic's page to confirm. The per-token list price did not change, so the cost per request can rise by up to 35% on an identical workload. Forecasting tools that assume the same tokeniser across model upgrades will under-report.
One more number is often misread: the vendor "90%+ hit rate" for semantic caching (Lever 2). I treat it as a match-accuracy figure unless the test corpus and the similarity threshold are disclosed.
Lever 8. Retrieval economics
C2.4. Retrieve less, and store vectors more cheaply.
Evidence: Peer-reviewed (PLAID, CIKM 2022: 7× GPU and 45× CPU latency reduction at no quality loss). Provider primary (Qdrant Binary Quantization: 32× memory reduction, up to 40× faster search, 98% recall@50 with oversampling). Leaderboard (MTEB / MMTEB, BEIR). No production case.
Most teams set top_k=10 and never tune it. Reduce it to the smallest k that holds recall on your evaluation set. Use tiered retrieval: a cheap recall pass, then a small reranker, and only the top three to five chunks enter the LLM context. Consolidate related sub-questions into one query.
Together with Lever 6, this is where the 67% drop in retrieval failures from Anthropic's Contextual Retrieval turns into cost savings. There are fewer retries, and a smaller context holds the same answer quality.
Quantisation is the concrete cost lever here. Qdrant's published Binary Quantization results report a 32× memory reduction and up to 40× faster search, holding 98% recall@50. That is with oversampling and rescoring on 4096-dimension embeddings. PLAID (Santhanam et al., CIKM 2022) reports 7× GPU and 45× CPU latency reduction on late-interaction retrieval at no quality loss. Some of the saving attributed to this lever overlaps with Lever 6 (retrieval engineering) and Lever 7 (caching). Count it once.
Lever 9. Output shaping
C2.5. Output tokens are the expensive ones.
Evidence: Peer-reviewed (XGrammar, MLSys 2025: up to 3× on JSON Schema, over 100× on context-free grammars). Provider primary (OpenAI Structured Outputs: 100% schema adherence against under 40%). Benchmark (Aider unified diffs: 20% to 61% on Aider's laziness benchmark, roughly 3× fewer wasted output tokens). No production case.
Output tokens cost four to five times more than input on current models (Claude Opus 5.5: $4 in and $20 out per million tokens; GPT-6.1 Sol: $2 in and $10 out). Reasoning tokens bill as output. Force structured outputs with JSON schemas, hard length caps and enum constraints. Do not allow a narrative "analysis" before the structured answer.
Lever 10. Prompt compression
C2.6. Shrink the tokens, keep the information.
Evidence: Peer-reviewed (LLMLingua, EMNLP 2023: up to 20× compression at minimal loss; LongLLMLingua, ACL 2024: +21.4% RAG performance at a quarter of the tokens). Benchmark-grade only: no named production deployment. See the caveat.
This is different from context engineering. Context engineering chooses which information enters the prompt. Prompt compression shrinks the tokens that carry that information. The two stack.
The LLMLingua family (Microsoft Research) is the most mature tool. It has three variants:
- LLMLingua: 20× compression with a 1.5-point accuracy drop on GSM8K (arXiv 2310.05736; Microsoft Research)
- LongLLMLingua: 94% cost reduction on the LooGLE long-context benchmark, and a 17.1% performance gain on NaturalQuestions with four times fewer tokens (arXiv 2310.06839)
- LLMLingua-2: a BERT-size classifier, three to six times faster than the original, and task-agnostic
Evidence caveat. LLMLingua's benchmark numbers are peer-reviewed (EMNLP 2023). No named team has published a production deployment with measured before-and-after cost. I treat this as benchmark-grade evidence until a named production case appears.
Where it works well:
- RAG with long retrieved context (80 to 95% cut in input tokens)
- Few-shot prompts with many demonstrations
- Long conversation histories
- Question answering over retrieved document chunks
Where it fails:
- Schema and structure instructions. Compressing these breaks parsing.
- Short prompts. The overhead exceeds the savings.
- Languages that are underrepresented in the compressor's training data.
It stacks with caching. Cache the compressed prompt. Hit rates stay similar, and the cached content is already compressed, so the savings multiply.
In operation. Compress the long context block only. Keep the schema instruction and the format specification verbatim. Check output quality on a regression set before rolling out. Compression that breaks parsing costs more than the tokens it saves.
C3. CONSTRAIN
How does the runtime behave?
Lever 11. Harness engineering
C3.1. Bound what the agent can spend.
Evidence: Peer-reviewed (HAL, ICLR 2026, arXiv 2510.11977: 21,730 rollouts, with the harness treated as a cost variable in its own right). Provider primary (Anthropic harness-design guidance). Leaderboard (Terminal-Bench 4.0, SWE-bench Pro, GAIA). Vendor-run benchmarks (LangChain Deep Agents: +13.7 points on Terminal-Bench 2.0 with the model held fixed; the NVIDIA and LangChain Nemotron playbook: about 10× lower cost per run at near-parity accuracy). No production case.
Most hidden cost sits in unbounded ReAct loops. They spend tokens on proving they are stuck. Princeton's HAL (arXiv 2510.11977) finds the most expensive model costing an order of magnitude more than mid-tier options, and a 9× cost gap between two agents on one benchmark.
I treat three controls as mandatory:
max_steps,max_tool_calls,max_wall_timeand explicit stop conditions- State machines or plan-then-execute where the task has structure
- Step-level traces, so cost can be attributed
2026 update: harness engineering became a named discipline. Through 2025 the runtime around the model was called the scaffold, the agent loop, or nothing at all. In 2026 it got a name, a formula and a literature. The working definition is agent = model + harness. The harness is every piece of code, configuration and execution logic outside the model. LangChain's Vivek Trivedy put it as "if you're not the model, you're the harness" (Mar 2026). Addy Osmani set out the thesis in "Agent Harness Engineering" (O'Reilly Radar, Apr 2026). In his words, "A decent model with a great harness beats a great model with a bad harness." Anthropic published harness-design guidance for long-running work. OpenAI adopted the term for Codex. Lilian Weng wrote a Lil'Log post on it (Jul 2026). The named sub-patterns are now stable:
- self-verification loops
- context middleware
- environment-awareness injection
- loop detection
- subagent delegation
- compaction
- trace-driven optimisation
Why this matters for cost as well as quality: the first hard cost figure arrived in July 2026. NVIDIA and LangChain tuned only the harness around Nemotron 3 Ultra. It reached 0.86 on the Deep Agents suite against 0.87 for Claude Opus 4.8, at about 10× lower cost per run ($4.48 against $43.48), at comparable latency (LangChain; NVIDIA). I read that number as directional. It is vendor-run, on one suite of 127 examples, with the harness tuned for that model. No independent replication has been reported. The direction is still the argument of this lever.
What the leaderboards show. "A smaller model in a good harness beats a larger model in a poor one" used to be intuition. In 2025 and 2026 it became measurable. Four examples:
1. Terminal-Bench 2.0: same model, harness rebuild, +13.7 points. LangChain's coding agent went from outside the top 30 to the top 5 on Terminal-Bench 2.0, from 52.8% to 66.5%. It changed only the harness and held the model fixed at GPT-5.2-Codex (LangChain, Feb 17, 2026).
Caveat on SWE-bench Verified. OpenAI stopped reporting SWE-bench Verified scores in February 2026. It cited contamination and the outsized effect of the agent harness. Its audit found that 59.4% of the hardest unsolved Verified problems had flawed test cases (OpenAI, Feb 2026). The same Opus 4.5 model scores 80.9% on Verified but 45.9% on Scale AI's SEAL-graded SWE-bench Pro under a standardised harness. SWE-bench Pro and SWE-bench Live are the preferred successors. I report SWE-bench Verified results where the cited research used them, because they were the standard at the time. Read them with the contamination problem in mind.
2. Mini-SWE-Agent: a minimal harness does well. SWE-agent's Mini-SWE-Agent is about 100 lines of Python, with no tool beyond bash. Its README reports more than 74% on SWE-bench Verified, ahead of most heavily engineered frameworks.
3. BrowseComp-Plus: retrieval engineering beats a model upgrade. Pairing GPT-5 with the Qwen3-Embedding-8B retriever raised accuracy from 55.9% to 70.1%, with fewer search calls. That is a 14-point gain from changing only the retriever (Chen et al., arXiv 2508.06600, Aug 2025). In the same paper, open-source Search-R1 with a BM25 retriever scores 3.86%. For deep-research agents, the retriever decides much of the outcome.
4. GAIA: the harness outweighs the base model. Hugging Face's smolagents code-agent variant scored 44.2% on GAIA validation and 33.3% on test. GPT-4 Turbo alone scores about 7% (Hugging Face blog). On this benchmark the harness contributes several times what the base model does.
The pattern holds across benchmarks:
| Benchmark | Same-model harness gap | Smaller-model-beats-larger evidence |
|---|---|---|
| Terminal-Bench 2.0 / 4.0 | +13.7pp (LangChain rebuild, 2.0); within about 2pp at the flagship tier on 4.0 | GPT-6.1 Sol ties GPT-6 Astra in Codex at 18% of the run cost |
| BrowseComp-Plus | 55.9% to 70.1% via retriever swap | Retriever choice > model size |
| GAIA | smolagents code-agent 44.2% vs about 7% base model | Tool-augmented small models beat larger unaugmented ones |
Part 1 charts the current same-model harness data (Part 1, Figure 4). The table below uses Terminal-Bench 4.0 in October 2026. It compares each model in its vendor's harness with the same model in a 100-line minimal harness.
| Tier | Vendor harness against minimal harness | Examples |
|---|---|---|
| Flagship models | Within about 2 points, and sometimes behind | Claude Opus 5.5 −0.4; GPT-6 Astra −1.4 |
| Cheaper tiers and weaker labs | +3 to +9 points | GPT-6.1 Sol +3.2; GPT-6 Sol +5.0; Grok 4.7 +8.8 |
| Cross-vendor pairing | Up to −12 points | Qwen3.8-Max in Claude Code −11.9 |
| Optimised harness, model fixed | +13.7 points | LangChain Deep Agents, Terminal-Bench 2.0 |
So the cost implication now has two tiers. Below the flagship tier, and in any multi-vendor setup, harness work still buys capability that would otherwise cost a model upgrade. At the flagship tier, an off-the-shelf harness no longer adds measurable capability. There, the harness's value lies in what it controls: steps, tokens, caching, routing and permissions. An optimised harness still adds double digits at any tier. The cost lever in this section is the second kind. It bounds what the agent spends, whatever the model.
The Terminal-Bench team built Terminus 2 for this reason. It is a neutral harness with only a headless terminal, used as a testbed for comparing models. Headline numbers on any agent leaderboard are joint scores of model and harness.
Bottom line. When you read "Model X scores Y% on benchmark Z", ask three things. Which harness ran it? At what effort? On which benchmark version? Below the flagship tier, a harness change still moves results by several points. Across vendors it can cost twelve.
Leaderboard status, October 2026. Terminal-Bench 4.0 replaced 2.x as the main harness board in August. It has 66 tasks, each about four hours of expert work, with an eight-hour agent budget. Its scores do not compare with 2.x. Epoch AI rated it "Flawed", with scoring defects in 30 of 66 tasks. Read its numbers as the best signal available, with known defects (Part 1 has the detail).
Lever 12. Tool design and call discipline
C3.2. Keep tools few, schemas short and outputs compact.
Evidence: Peer-reviewed (Toolformer, NeurIPS 2023; Gorilla, NeurIPS 2024). Provider primary (Anthropic, "Writing effective tools for AI agents": concise response formats cut token usage by up to 65%, from 206 tokens to 72; "Code execution with MCP"). Leaderboard (BFCL v4, τ-bench / τ2-bench). No production case.
Tool calls are network round trips, with their own latency and retry costs. Tool schemas sit in the input tokens on every call. An oversized tool set causes "context confusion". The model invents parameters or picks the wrong tool (Anthropic, Sep 2025).
The controls:
- Batch independent tool calls
- Fail fast on validation errors before calling the model again
- Use idempotency keys so a retry does not repeat work
- Keep tool outputs compact: return the few fields the step uses
- Trim schemas: if a human engineer cannot pick the right tool, the agent cannot either
The MCP metadata tax. Model Context Protocol tool registrations are expensive in context. With a large tool catalogue, schema metadata can take up a large share of the context window. Two mitigations work in practice. Discover tools dynamically, as the session needs them. Or move to CLI-first or Skills-based designs, where tool capability lives in code the agent calls and the model reads fewer schemas. If you have a long tool list and a slow, expensive agent, look here first.
Lever 13. Reasoning discipline
C3.3. Set the effort level per workload.
Evidence: Peer-reviewed (s1, EMNLP 2025: budget forcing gives a measured curve of accuracy against thinking tokens; HAL, ICLR 2026: higher reasoning effort gave equal or lower accuracy in 21 of 36 model, agent and benchmark combinations). Provider primary (Anthropic and OpenAI effort controls; Opus 5.5 rejects fixed thinking budgets). Leaderboard (Aider Polyglot, cost-tracked). No production case. See the Price Reversal caveat.
Reasoning tokens are billed at output rates. They are easy to miss in cost forecasts because they do not appear in the response. The rule I follow: don't reason about things you can look up. Current flagship models decide their own reasoning depth within an effort level you set. The application still decides when a reasoning model is the right tool at all. For retrieval and classification, it is not.
2026 update: effort settings replaced thinking budgets, and they move cost more than model choice does. Princeton's HAL (arXiv 2510.11977, ICLR 2026) ran 21,730 rollouts. Higher reasoning effort gave equal or lower accuracy in 21 of 36 model, agent and benchmark combinations. The providers have since removed the fixed budget as a control:
- Anthropic. On Claude Opus 5.5, thinking is always on. A request that disables thinking or sets
budget_tokensreturns a 400 error. Depth is set with the effort parameter. The default ismediumon Opus 5.5 andhighon Sonnet 5.5 and Fable 5.1. Anthropic notes that at the same effort, Opus 5.5 "tends to think more per turn" than Opus 5. It tells developers to re-run their effort sweep after upgrading (Anthropic, What's new in Opus 5.5).- OpenAI. GPT-6.1 Sol and GPT-6 Astra support
lowtomaxeffort and do not supportnone. GPT-6.1 Terra, GPT-6 Sol and GPT-6 Luna do. Aconfiguration_updateinput item changes effort mid-conversation without breaking the prompt cache (OpenAI).- Google. Output prices include thinking tokens (Gemini API pricing).
The cost range inside one model is now wider than many model swaps. Claude Opus 5.5 scores 35 on Artificial Analysis's Intelligence Index at low effort and 58 at max. Max effort costs 10× as much per task ($0.98 against $10.04) (Artificial Analysis, Oct 27, 2026). In practice: run an effort sweep per workload, start from the default, and raise effort only on the turns that need it.
C4. COMMODITISE
What does each unit cost?
Lever 14. Fine-tuning and distillation
C4.1. Make a small model good at one narrow task.
Evidence: Peer-reviewed (QLoRA, NeurIPS 2023 oral; LoRA, ICLR 2022). Provider primary (AWS Bedrock Model Distillation). Named customer (Predibase and Convirza, Giuseppe Romagnuolo: 10× lower operational cost, +8% F1, +80% throughput; vendor case study). Production (Together AI: a 2 to 3× cost cut at 77% to 87% accuracy; Databricks: 90% accuracy at 5× lower cost).
On a narrow, repetitive task, a fine-tuned small model can match a large model at a fraction of the cost. Published results:
- TensorZero. Fine-tuned small models matched or beat GPT-4.1 zero-shot on data extraction, at 5 to 30× cheaper inference (self-reported; TensorZero)
- Predibase and Convirza. 10× lower cost than OpenAI, +8% F1 and +80% throughput. LoRA adapters on a shared Llama-3-8B replaced per-indicator Longformer deployments that cost $500 to $1,500 a month each (self-reported; Predibase customer case study)
- Predibase and Checkr. 5× lower cost than GPT-4, about 30× faster, and 90% accuracy on the hardest 2% of cases (self-reported; Predibase customer case study)
- OpenPipe, per CEO Kyle Corbitt (Sacra interview, self-reported): "Companies like Ramp, Notion and Databricks ... reducing their costs by 90% for specific, repetitive tasks" (Sacra, 2024)
It is worth doing when three things hold. Task volume justifies the dataset and evaluation work. The task is stable. And you have evaluations that will catch a regression.
Lever 15. Service tiers and time-shifting
C4.2. Run each workload in the cheapest tier that meets its deadline.
Evidence: Peer-reviewed (Orca, OSDI 2022: 36.9× throughput at fixed latency, the mechanism behind async discounts; PagedAttention, SOSP 2023). Provider primary (Batch and Flex at 50% across OpenAI, Anthropic and Google; DeepSeek off-peak at 50%; Fast and Ultrafast at 2× and 6×). No production case.
When inference runs is now a pricing axis, alongside what runs. The major providers offer three or four service tiers that trade latency for cost. Map every workload to the cheapest tier that meets its service level.
Provider service tiers in 2026:
| Tier | Price vs Standard | Where it exists (October 2026) | When to use |
|---|---|---|---|
| Ultrafast | 6× | OpenAI GPT-6 Astra ($60/$300) and GPT-6.1 Sol | Latency-critical paths that justify any price |
| Fast / Priority | About 2× | OpenAI Fast (renamed from Priority on July 30, 2026); Anthropic fast mode on Opus 5.5, $8/$40, up to 2.5× output speed; Google Priority, 1.8× | User-facing real time, voice |
| Standard | 1× | All providers | Default for interactive workloads |
| Flex | 0.5× | OpenAI | Async user features, non-critical paths |
| Batch | 0.5× (0.6× at Moonshot) | OpenAI, Anthropic, Google, Moonshot | Bulk jobs, evaluations, nightly enrichment |
| Off-peak | 0.5× of peak | DeepSeek: peak is 01:00 to 04:00 and 06:00 to 10:00 UTC on weekdays; all other hours are off-peak | Anything that can wait for the window |
Source: provider pricing pages, checked October 31, 2026 (OpenAI; Anthropic fast mode; Google; DeepSeek; Moonshot). Anthropic's fast mode cannot be combined with Batch.
Decision rule. Is a user waiting in real time? Use Standard or Priority. Can the result wait a few minutes? Use Flex. Within a day? Use Batch. The same workload in the wrong tier can cost twice as much.
Stacking discounts. Batch combines with prompt caching. On GPT-6.1 Sol, a cached input token in a Batch job costs $0.05 per million, against $2 for an uncached Standard token. That is 2.5% of base (OpenAI pricing). Output tokens get only the Batch half, so output-heavy work saves less.
What qualifies for time-shifting. Anything whose result no user is waiting for. Candidates:
- Evaluations and regression suites
- Document processing pipelines
- Nightly data enrichment and summarisation
- Offline content generation
- ETL-style extraction at scale
- Knowledge base reindexing
Operational discipline. Track tier drift. Workloads move up the tier ladder when teams do not measure. Schedule heavy Flex jobs off-peak to reduce contention. Build retry with backoff for Flex 429 errors. Tag every request with its intended tier in observability.
Prices now move in different directions by vendor, and some rises are already scheduled. In September and October 2026:
- Anthropic cut its flagship. Claude Opus 5.5 is $4/$20 per million tokens, down from $5/$25 for Opus 5.
- OpenAI added a tier above its old flagship. GPT-6 Astra is $10/$50, with Ultrafast at $60/$300. GPT-6.1 Sol sits at $2/$10 and GPT-6.1 Terra at $1/$5.
- Google launched at introductory prices with dated increases. Gemini 4 Argon doubles from $2/$10 to $4/$20 on December 1, 2026. Gemini 3.8 Flash doubles from $0.75/$3.75 to $1.50/$7.50 on January 1, 2027. Batch and Priority prices double on the same dates.
- DeepSeek introduced time-of-day pricing on August 16, 2026. Off-peak costs half the peak rate.
Sources: provider pricing pages, checked October 31, 2026. I draw three implications. Budget at the post-promotion price. Do not forecast that tokens get cheaper every quarter: the price of reaching a given capability falls, but the price of the top model has gone up. And the ladder from the cheapest to the most expensive tier at OpenAI is now about 100× wide ($0.10 to $10 input). That makes Lever 1 worth more than it was a year ago.
Lever 16. Self-hosted vs managed APIs
C4.3. Own the serving stack only when utilisation pays for it.
Evidence: Peer-reviewed (DistServe, OSDI 2024: 7.4× more requests or 12.6× tighter SLO; Orca, OSDI 2022; PagedAttention, SOSP 2023). Provider primary (NVIDIA cost-per-token TCO framing). No production break-even case: Uber's open-weight serving on Ray and vLLM shows the pattern only. No audited public break-even threshold survives source review: see the caveat.
The most common question on this lever: when does self-hosting beat paying per token?
Short answer. For most teams in 2026, APIs win. The break-even point is higher than people expect. I looked for a published range of estimates:
| Source | Break-even threshold | Notes |
|---|---|---|
| No audited public break-even survives source review | n/a | See evidence caveat below |
Evidence caveat. No audited public break-even threshold for self-hosting against managed APIs survives source review. Published estimates disagree by about 50×, because each hides a different utilisation assumption. My reading is that break-even depends on utilisation more than on token volume. A GPU at 10% load carries about 10× the per-token cost of the same GPU at 100%. Re-run the numbers on your own traffic and target hardware before relying on any external figure.
October 2026 update: the open-weight gap widened on the newest measure. Through mid-2026 the gap narrowed: on Artificial Analysis's Intelligence Index v4 it was 3 points. Version 5, published October 27 with 60% of its evaluations on private test sets, puts it at 12 points, with Claude Opus 5.5 at 58 and the top open-weight model (Kimi K3.1 Pro) at 46. Kimi K3.1 Pro had not yet released its weights. Among models whose weights are out, DeepSeek V4.1 Flash 1017 and GLM-5.3 lead at 32, 26 points behind Opus 5.5 (Artificial Analysis, Oct 27, 2026). Gemini 4 Carbon, added the next day at 59.4 (Figure 2), widens both gaps by 1.4 points (Artificial Analysis, Oct 28, 2026). Part of the widening comes from the switch to private test sets. Epoch AI's last general estimate is still a lag of 4 months, or 8 ECI points (May 2026). Do not plan on a narrowing gap.
Agentic coding tells a different story. On Terminal-Bench 4.0, Kimi K3.1 Pro scores 63.64%. That is 1.5 points behind the leader, at about a third of the cost per solved task (see "What cost is"). Its list price is $2/$10 per million tokens, against $4/$20 for Claude Opus 5.5 (Moonshot). So the gap in cost per task comes as much from token use as from price. DeepSeek V4.1 Flash solves fewer tasks (31.82%) but costs about $1.70 per solve, at $0.15/$0.60 off-peak (DeepSeek).
Two cautions before you act on this. First, a hosted open-weight model is a managed API. A cheap hosted tier weakens the case for the frontier API, and it also weakens the case for running your own GPUs. Second, check the licence and weight status before planning a deployment. Moonshot describes Kimi K3.1 Pro as open-weight, but had not published a release date or licence by October 31.
The direction of this lever is more reliable than any single number. Self-hosting can beat proprietary frontier APIs at lower volumes than it can beat cheap hosted open-weight APIs. Three things drive most of the variance: what you compare against, your sustained utilisation, and the fully loaded cost of running the stack.
The total cost of self-hosting is a multiple of the GPU price. Published breakdowns list the same hidden items:
- GPU rental or amortisation
- redundancy for failover
- a monitoring stack
- refresh cycles
- a real share of an ML infrastructure engineer's time
Check any single number from a vendor blog against your own costs.
When self-hosting makes sense:
- Data residency requirements that no API can satisfy. HIPAA, financial regulators in specific jurisdictions, and GDPR Article 28 in some cases.
- Sustained high volume above the break-even for your comparison baseline. Verify with 30 days of real production traffic before procurement.
- Owned fine-tuned weights, where the IP value justifies the infrastructure. This is the best-documented path. Predibase's customer cases (Convirza, Checkr) and OpenPipe's customer pattern (per Kyle Corbitt, Sacra interview: Ramp, Notion, Databricks) sit here.
- Open weights meet the quality bar. In October 2026 the gap was about 12 points on Artificial Analysis's index, 26 for models with released weights, and about 1.5 points on agentic coding (see above). Verify on your own task.
- The latency floor matters. On-premise inference removes the round trip to a cloud provider.
Most production setups end up with a hybrid. Self-host the predictable bulk on tuned open weights. Use APIs for high-value, bursty or frontier-only work. Put one router between them.
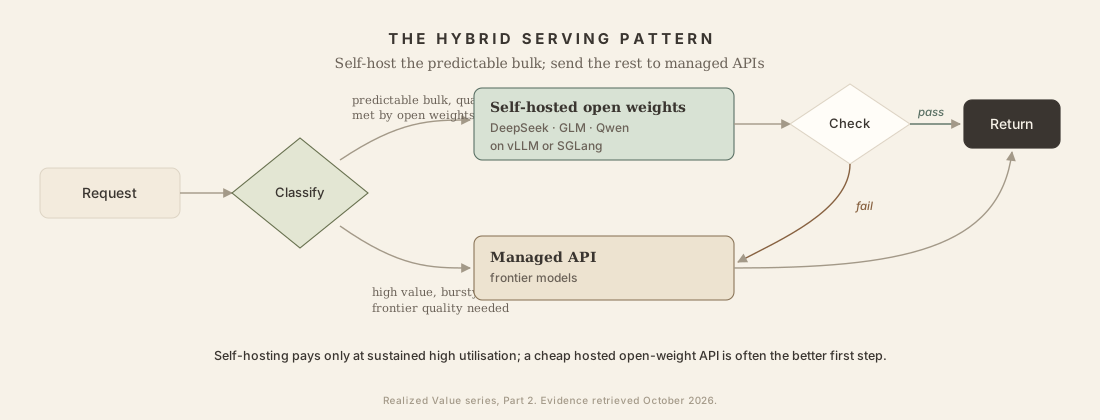
The serving stack matters as much as the model. If you self-host, three engines lead in 2026:
- vLLM: highest throughput, with PagedAttention and continuous batching. The default for production.
- SGLang: strong on structured output and complex prompt programs.
- TensorRT-LLM: best raw NVIDIA performance, and the most complex to operate.
Avoid Ollama for production traffic. It is built for local development.
Quantisation is the cheapest serving optimisation. A 70-billion-parameter model such as Llama 3.3 70B needs about 140GB for its weights at 16-bit precision (two bytes per parameter). At 4-bit (AWQ or GPTQ) the weights take about 35GB, so the model fits on one 80GB GPU with room for the KV cache. Measure the quality drop on your own tasks.
Spot or preemptible GPU instances sell spare capacity at a discount, with the risk of interruption. They suit batch and evaluation work. Use checkpointing.
Lever 17. Speculative and parallel execution
C4.4. Do independent work at the same time.
Evidence: Peer-reviewed (Leviathan, Kalman and Matias, ICML 2023 oral: 2 to 3× acceleration at an identical output distribution; EAGLE, ICML 2024). Provider primary (vLLM and SGLang serving docs). Serving-engine benchmarks (vLLM EAGLE 3.1: 2.03× per-user output throughput; Snowflake Arctic Inference: 2.05 to 2.45× over non-speculative vLLM). No production case. See the caveat on multi-agent parallelism.
Run retrieval in parallel, run independent tool calls in parallel, and stream output to hide latency. These are mostly latency wins. They also reduce user retries and abandonment, which cuts cost another way.
Evidence caveat on multi-agent parallelism. Anthropic's engineering post on its multi-agent research system tested an Opus orchestrator with parallel Sonnet sub-agents. It outperformed single-agent Opus by 90.2% on an internal evaluation. It also used about 15× more tokens than a chat conversation (Anthropic, 2025). This is parallel execution buying quality at a token premium. It belongs in this lever because the architecture is parallel. It is a quality case, with a cost premium. The cost-reduction half of this lever (speculative decoding) rests on serving-engine benchmarks (vLLM, SGLang). I found no published production case study.
C5. CALIBRATE
How do we know any of this works?
Lever 18. FinOps telemetry
C5.1. Attribute every dollar to a step, a tenant and an outcome.
Evidence: Peer-reviewed: none for cost attribution. Related work (Price Reversal Phenomenon, arXiv 2603.23971, preprint: list price mis-ranks true cost in 32% of model pairs; HAL, ICLR 2026: cost-aware evaluation). Industry primary (FinOps Foundation, State of FinOps 2026: 98% of 1,192 respondents now manage AI spend, up from 31% two years earlier). Production (Helicone, more than 2B interactions; Cloudflare per-user cost attribution).
This lever covers three things:
- cost attribution per step, per tenant and per cohort
- anomaly detection on cost per task
- spend budgets enforced at the orchestration layer as well as in provider dashboards
The FinOps Foundation's 2026 State of FinOps report names AI and data platforms as the fastest-growing new category of enterprise spend. Token-based pricing brings volatility that legacy budgeting cannot handle.
What enterprises report. Gartner's survey of 2,002 CIOs, published October 19, 2026, found that only 13% report significant or transformational value from AI. Only 17% of their organisations have guidelines for abandoning low-value AI already in production (Gartner, Oct 19, 2026). A stopping rule needs cost per successful task for each use case. Without attribution there is nothing to stop on.
The macro picture. FinOps for AI is the top forward-looking priority for FinOps practitioners in the 2026 State of FinOps report (FinOps Foundation, Feb 2026). The Foundation changed its mission from "value of cloud" to "value of technology", to include AI and data spend. For the levers in this article, I read this as putting inference in cost of goods sold. Every cost lever becomes a margin lever as well as an efficiency one.
The evidence for each lever
Every one of the 18 levers is backed by published evidence. That means a public leaderboard, a peer-reviewed benchmark, a number the vendor disclosed, or a production case study. The strength of the evidence varies. Some levers have several leaderboards. Others have one production case I can cite. No lever rests on consultant opinion. The table at the end of this section names the strongest evidence for each one.
Five leaderboards are worth knowing by name. They anchor the cost and quality discussion for most of the framework.
Princeton HAL (Holistic Agent Leaderboard, ICLR 2026). This is the most relevant cost-aware leaderboard for agents. The ICLR paper covers nine benchmarks, and the live leaderboard lists more (SWE-bench, USACO, GAIA, τ-bench, ScienceAgentBench, Cybench, AgentHarm, CORE-bench and others). It plots accuracy against token cost as Pareto frontiers (Kapoor et al., arXiv 2510.11977). Each entry is tagged with whether it sits on the frontier. I recommend this format for every internal evaluation. In my view, single-axis benchmarks are one of the main causes of cost overrun.
Status note. In late 2025 the Princeton team paused new-model updates to the main HAL leaderboard. They moved to the HAL Reliability Dashboard, which scores agents on consistency, predictability, robustness, safety and abstention. Their finding: "despite 18 months of model development, overall reliability shows only small improvements over time while accuracy steadily climbs." The Pareto format is still the right design. The live leaderboard is no longer the place to track new models.
Vals AI Terminal-Bench 4.0. This is the board behind the cost-per-solved-task table in "What cost is". It runs every model in the same minimal harness (mini-SWE-agent), averages three runs, and publishes cost per test next to accuracy (Vals AI). The harness is fixed, so cost differences come from the model and its token use.
Artificial Analysis Intelligence Index v5 (October 27, 2026). It reports cost per task as a headline metric across nine evaluations. 60% of them use private test sets (Artificial Analysis). It also publishes each model at several effort levels, which shows the effort and cost trade-off in Lever 13. One finding stands out. Median output tokens per task rose from 35,000 to 59,000 between index versions. Token use per task can grow faster than prices fall.
Berkeley Function Calling Leaderboard (BFCL v4). This is the standard tool-use benchmark, and it now has cost and latency columns (Patil et al., gorilla.cs.berkeley.edu; OpenReview). The pattern matters for Lever 12 (tool design) and Lever 14 (fine-tuning). Databricks reports that smaller open-source models (DBRX, Llama-3-70B) can be lifted by careful prompting and parsing. In some aspects they come close to GPT-4 quality or pass it (Databricks, 2024).
Version note. BFCL v3 (multi-turn, late 2024) is now saturating, with Llama 3.1 405B at 88.5% and a tight cluster at the top. The small-model results above are on v3. BFCL v4 launched in April 2026 with "holistic agentic evaluation" and is much harder. Early v4 scores are far lower. When you cite BFCL, name the version. v3 numbers do not compare to v4 numbers.
This matches the harness evidence in Lever 11. Tool design, prompting and, where justified, fine-tuning set tool-use quality more than model size does.
NoLiMa and RULER (long-context benchmarks). These are the strongest support for Lever 5 (context engineering). Both measure how accuracy falls as context grows.
- NoLiMa (ICML 2025): "at 32K context, 10 of 12 models drop below 50% of their short-length baselines." GPT-4o falls from 99.3% to 69.7% at 32K. For most models the effective context length is 2K tokens or less, though they advertise 128K or more (Modarressi et al., arXiv 2502.05167).
- RULER (NVIDIA): "Only half" of the models that claim 32K context can use 32K. "Almost all models fall below the threshold before reaching the claimed context lengths" (Hsieh et al., arXiv 2404.06654).
This is the evidence for context budgets. Filling context past the effective length costs more and also lowers quality. Lever 5 is one of the few cost levers where cost and quality improve together.
MTEB and MMTEB (Massive Text Embedding Benchmark). This is the public leaderboard for retrieval quality, and it bears directly on Lever 8 (MTEB leaderboard). The cost pattern as of April 2026:
- Self-hosted open-weight embedding models (Qwen3-Embedding-8B, for example) now compete with the top commercial APIs on MTEB and MMTEB. Self-hosted embeddings are a workable cost path for high-volume indexing.
- OpenAI's text-embedding-3-small costs $0.02 per million tokens and scores 62.26.
- For multilingual work, NVIDIA's open-weight Llama-Embed-Nemotron-8B leads multilingual MMTEB. Open weights beat proprietary here.
So for most production RAG the useful question is "which is cheapest at the recall my evaluation requires". The answer is usually a smaller open-weight model.
Every lever, named evidence
I check each lever against three independent types of evidence.
- Peer-reviewed. A paper at a recognised venue (ICLR, NeurIPS, ICML, EMNLP, ACL, CIKM, OSDI, SOSP, MLSys, FSE), or a leaderboard run by a research group.
- Provider primary. Documentation or an engineering post from the model or infrastructure provider, with measured numbers.
- Production case. Deployment numbers from a named team, or a named customer with an attributed executive quote.
A production case needs a deployment. Benchmark results from a named team count as benchmarks. A lever is Strong when all three are present. It is Adequate when one is missing or its mechanism differs from the claim. It is Thin when the anchors are workshop-grade or absent.
| Lever | Peer-reviewed | Provider primary | Production case | Verdict |
|---|---|---|---|---|
| 1. Model routing | RouteLLM (ICLR 2025) | AWS Bedrock IPR (63.6%) | Uber GenAI Gateway; Cloudflare (10.57B tok/day) | Strong |
| 2. Deflection | vCache (ICLR 2026, 12.5× hit rate at bounded error) | Azure APIM semantic-cache policy; AWS ElastiCache (86% cost cut) | Walmart waLLMartCache (ICPR 2024) | Strong |
| 3. Workflow vs agent | HAL (ICLR 2026) | Anthropic, "Building effective agents" | None. Benchmark: smolagents (30% fewer LLM calls) | Adequate |
| 4. Confidence gating | FrugalGPT (TMLR); UCCI (preprint, 31%) | AWS Bedrock IPR | None that matches. Cloudflare's risk tiers ($0.20 vs $1.68) use a rule-based classifier | Adequate |
| 5. Context engineering | AgentDiet (FSE 2026); MemGPT | Anthropic context-engineering guide | Manus (100:1); OpenHands (about 50% cut) | Strong |
| 6. Retrieval engineering | PLAID (CIKM 2022); BrowseComp-Plus | Anthropic Contextual Retrieval (67%) | None. Evaluation: Sourcegraph, long context against RAG | Adequate |
| 7. Caching | PagedAttention (SOSP 2023); SGLang (NeurIPS 2024); Prompt Cache (MLSys 2024) | Anthropic (90% / 85%) | Notion, Simon Last; ProjectDiscovery (59%) | Strong |
| 8. Retrieval economics | PLAID (CIKM 2022, 7×/45×) | Qdrant Binary Quantization (32× memory, 40× faster) | None. Leaderboards: MTEB / MMTEB, BEIR | Adequate |
| 9. Output shaping | XGrammar (MLSys 2025) | OpenAI Structured Outputs (100% vs <40%) | None. Benchmark: Aider unified diffs (20% to 61%) | Adequate |
| 10. Prompt compression | LLMLingua (EMNLP 2023); LongLLMLingua (ACL 2024) | Microsoft Research (20×) | None published | Adequate |
| 11. Harness engineering | HAL (ICLR 2026, 21,730 rollouts) | Anthropic harness-design guidance | None. Vendor-run benchmarks: LangChain (+13.7 points); NVIDIA/LangChain (about 10× cheaper) | Adequate |
| 12. Tool design | Toolformer (NeurIPS 2023); Gorilla (NeurIPS 2024) | Anthropic tool-writing guide (65% token cut) | None. Leaderboards: BFCL v4; τ2-bench | Adequate |
| 13. Reasoning discipline | s1 (EMNLP 2025); HAL (ICLR 2026) | Anthropic extended thinking / adaptive effort | None. Leaderboard: Aider Polyglot (cost-tracked) | Adequate |
| 14. Fine-tuning / distillation | QLoRA (NeurIPS 2023); LoRA (ICLR 2022) | AWS Bedrock Distillation | Predibase / Convirza (10×, vendor case study); Together AI (2-3×) | Strong |
| 15. Service tiers | Orca (OSDI 2022); PagedAttention (SOSP 2023) | OpenAI Batch, Anthropic Batch (flat 50%) | None. Arithmetic: Batch with caching reaches 2.5% of base | Adequate |
| 16. Self-hosted vs API | DistServe (OSDI 2024); Orca (OSDI 2022) | NVIDIA cost-per-token TCO | None with a break-even figure; Uber (Ray + vLLM) shows the pattern | Adequate |
| 17. Speculative / parallel | Leviathan et al. (ICML 2023); EAGLE (ICML 2024) | vLLM / SGLang serving docs | None. Serving-engine benchmarks: vLLM EAGLE 3.1 (2.03×); Snowflake Arctic (2.05-2.45×) | Adequate |
| 18. FinOps telemetry | None for attribution. Related: Price Reversal (preprint); HAL (ICLR 2026) | FinOps Foundation State of FinOps 2026 | Helicone (2B+ calls); Cloudflare attribution | Adequate |
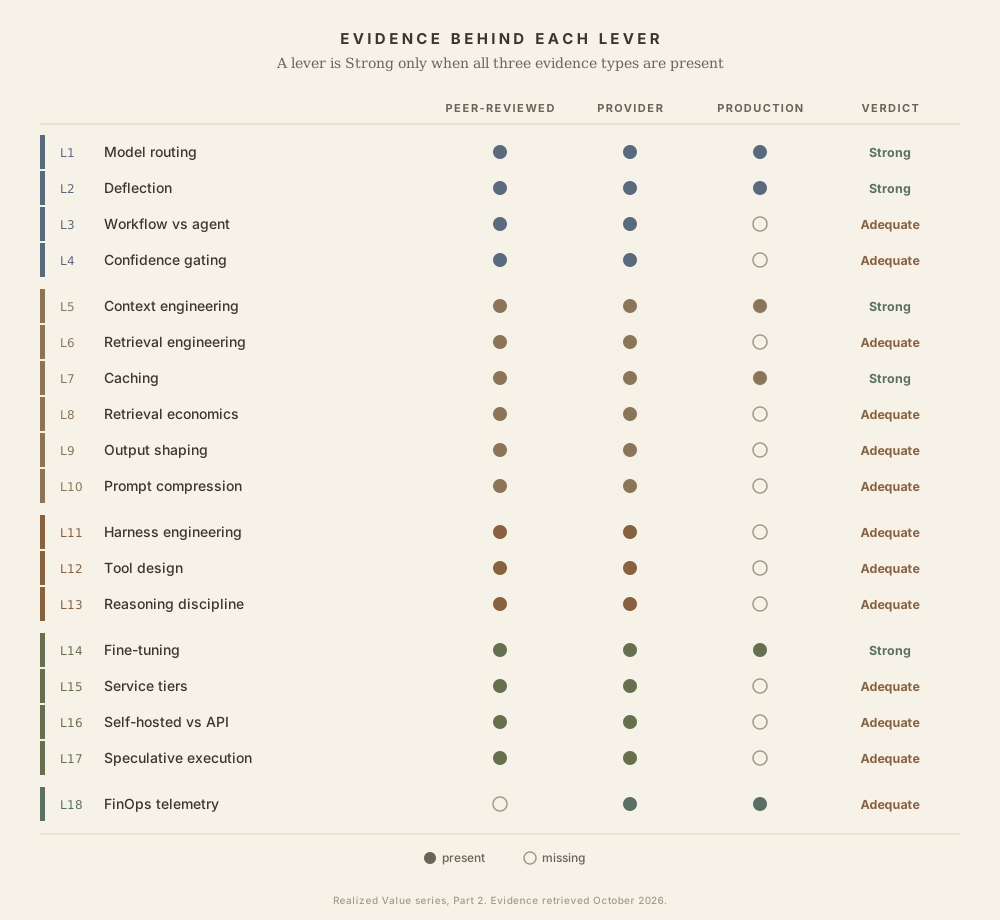
Five levers are Strong and thirteen are Adequate. None is Thin. Deflection (Lever 2) owes its main-track anchor to vCache, accepted at ICLR 2026. vCache also addresses the correctness problem that kept many teams from using semantic caching in production. It calibrates a threshold for each prompt, with an error bound the user sets.
Nine Adequate levers share one gap. Their third type of evidence is a benchmark, a leaderboard, an evaluation or a calculation, with no named deployment: Levers 3, 6, 8, 9, 11, 12, 13, 15 and 17. The other four fall short for their own reasons.
- Confidence gating (Lever 4) has strong evidence for the mechanism. The closest production case (Cloudflare) routes with a rule-based risk classifier, and a confidence score plays no part, so the mechanism differs from the claim.
- Prompt compression (Lever 10) has no published production deployment. Its peer-reviewed anchor and its provider primary come from the same team, so they are not independent.
- Self-hosting (Lever 16) has mechanism papers and the shape of known deployments, and no audited break-even point.
- FinOps telemetry (Lever 18) rests on an industry survey and production tooling. There is no peer-reviewed method for cost attribution.
Benchmark lifecycle: leaderboards expire
By mid-2026, several of the most-cited leaderboards from 2024 and 2025 were saturated or compromised.
- SWE-bench Verified (Aug 2024). OpenAI stopped using it in Feb 2026 because of contamination and harness variance. Successors: SWE-bench Pro, SWE-bench Live, SWE-Rebench.
- BFCL v3 (late 2024). Saturating at the top (Llama 3.1 405B at 88.5%). Successor: BFCL v4 (Apr 2026), with holistic agentic evaluation.
- Aider Polyglot (Dec 2024). Saturating near 89%. Part 1 lists it as usable only with caveats.
- Terminal-Bench 2.x (2025 to 2026). Replaced by 4.0 in August 2026, which Epoch AI rated "Flawed" a week later. Even the replacement needs careful reading.
HumanEval, MBPP and MMLU are fully saturated. They no longer separate frontier models. The time from launch to saturation, or to pressure for a successor, is now about 12 to 18 months. Plan your evaluation infrastructure with that in mind. Four rules follow for any team building an internal evaluation.
- Pin every claim to a benchmark version. "Best on BFCL" is ambiguous; "best on BFCL v4" is precise. The same goes for Terminal-Bench 2.x against 4.0, and SWE-bench Verified against Pro.
- Note the harness. The same model in a different harness can move several points, and up to 12 across vendors on Terminal-Bench 4.0 (Lever 11). The leaderboard entry alone does not predict your production score.
- Treat contamination as the default risk. Benchmarks built from public issues (SWE-bench, Exercism-derived sets) appear in training data. For trends, prefer boards that refresh continuously (SWE-bench Live, SWE-Rebench, LiveCodeBench).
- Budget for benchmark migration. Internal evaluations built on SWE-bench Verified in 2024 now give a degraded signal. Assume you will swap the underlying benchmark every 12 to 18 months.
This is what happens when static datasets meet a field that improves this quickly. For cost work, my reading is this: a leaderboard lags model quality, and it signals where the field will publish a successor. Where you can, build internal evaluations on your own production traces.
How the levers compound
Each lever reduces one cost component. How they stack matters more than any single number.
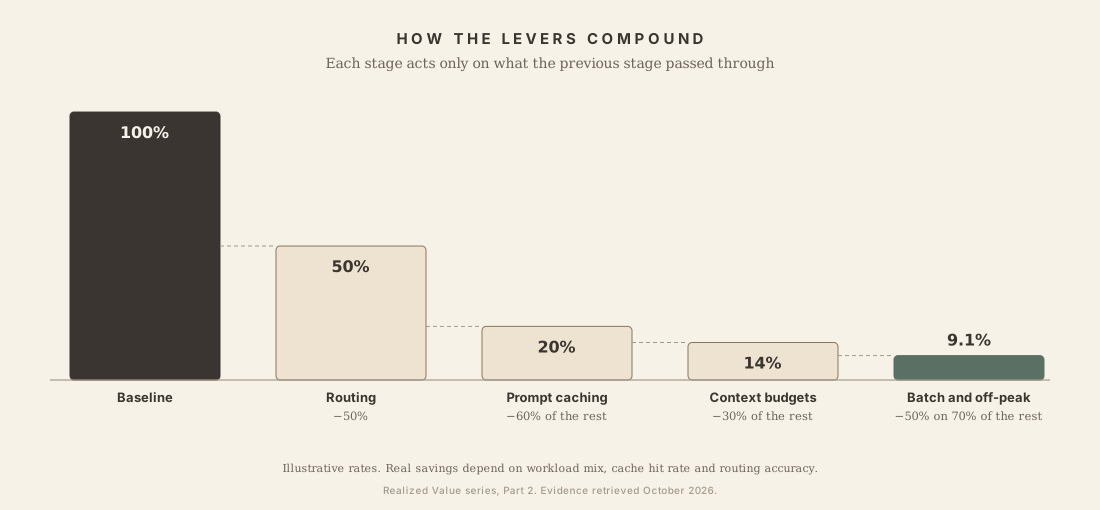
The composition is illustrative, and the savings do not add. They depend on the workload mix, cache hit rates and routing accuracy. These are the published anchor points.
| Lever | Reported savings | Source |
|---|---|---|
| Harness rebuild (same model) | +13.7 points on Terminal-Bench 2.0 (LangChain Deep Agents) | LangChain Deep Agents blog |
| Routing (RouteLLM) | 85% on MT-Bench at 95% quality | LMSYS |
| Prompt caching, current flagships | 95% on cached input tokens (Opus 5.5, Sonnet 5.5, GPT-6.1 Sol); 90% on Astra, Haiku 5.5, Fable 5.1 | Anthropic, OpenAI |
| Effort setting, one model | 10× cost per task between low and max (Opus 5.5) | Artificial Analysis |
| Oracle routing (upper bound) | 14 points better at about 40% lower cost | Vals AI |
| Off-peak pricing (DeepSeek) | 50% outside weekday peak windows | DeepSeek |
| Production prompt caching | 59% of total LLM cost | ProjectDiscovery |
| Batch API (OpenAI, Anthropic, Google) | 50% on input and output | OpenAI, Anthropic, Google |
| Contextual retrieval | 67% fewer retrieval failures | Anthropic |
| Retriever swap (BrowseComp-Plus) | 55.9% to 70.1%, with fewer search calls | Chen et al., arXiv 2508.06600 |
| Distillation (TensorZero) | 5 to 30× cheaper at the same quality | TensorZero |
| AWS Bedrock Intelligent Prompt Routing | 63.6% average cost saving (self-reported; AWS tests on RAG datasets, 87% routed to Haiku) | AWS, Apr 2025 |
Traps
Eleven common ways to mis-spend the cost budget.
| Trap | What it looks like | Why it bites |
|---|---|---|
| The Small Model Fallacy | Force the cheapest tier on every step | Escalations climb past 50%, and retries cost more than the cheaper tier saves. On Terminal-Bench 4.0, some of the cheapest models per token are among the most expensive per success |
| The Frontier Trap | Default to the top model on every step | Within a generation, models within 2 points of each other differ 3× in cost per solved task |
| The Launch-Price Trap | Plan on an introductory price | Gemini 4 Argon and 3.8 Flash double on announced dates |
| The Max-Effort Trap | Treat max effort as the safe setting | 10× the cost per task of low effort on Opus 5.5, and HAL finds more effort often lowers accuracy |
| The Cold-Cache Trap | Switch models on every step of a long session | Each switch starts a cold prompt cache |
| The Stale-Cache Trap | High hit rate, weak invalidation | Wrong answers cost more than the savings |
| The Over-Compaction Trap | Drop history aggressively | The model loses evidence it needs; hallucinations and rework rise |
| The Agent-for-a-Form Trap | Multi-step ReAct loop for a form | The most expensive architecture mistake; no later optimisation recovers it |
| The Token KPI Trap | Dashboard counts tokens and ignores tasks | "$X saved" while users leave |
| The Prefix-Order Trap | Turn on caching without restructuring the prompt | ProjectDiscovery's hit rate stayed in single digits until it moved dynamic content out of the prefix |
| The Batch-for-Interactive Trap | Turn on batch for all traffic | A 24-hour SLA breaks interactive use |
The first two are the same mistake made in opposite directions. Both choose a model by price per token. The measure that matters is cost per solved task.
Order of operations
This is the sequence I recommend for cutting cost with the least risk.
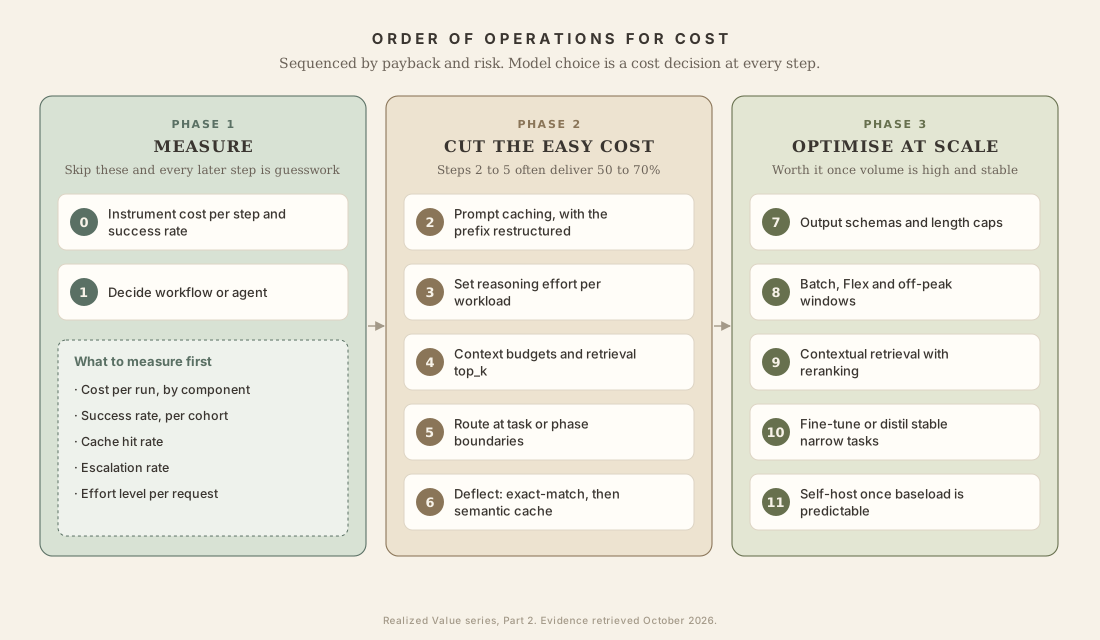
Steps 0 and 1 are measurement. Skip them and you cannot tell signal from noise in anything that follows. Steps 2 to 5 deliver most of the saving (see Claim 3). Step 3 (setting the effort level) is new. On current flagships it moves cost per task more than most model swaps. Fine-tuning and self-hosting matter only at scale, or after the earlier steps are done.
Open problems
Six questions are still open across the 5 Cs. Each comes from the trade-offs above.
-
Auto-budgeting for agent trajectories (C1 and C2). Today's best practice is a hand-tuned budget for each step. The open problem is a runtime that spreads a token budget across a trajectory as it runs, given a quality target and a cost cap. AgentDiet shows there is room (40 to 60% of tokens removable). The controller does not exist yet.
-
Choosing the retrieval primitive at runtime (C2). Grep, vectors, reranking or direct corpus access is a fixed architecture choice today. The open problem is to make it a decision the harness takes for each query, based on the query and the corpus. Embedding-only retrievers fail on exact constraints. Pure grep fails on semantic queries. The answer is a router, and I have not seen one shipped.
-
Harness portability across model upgrades (C3). Every harness encodes assumptions about what the model does reliably. As models improve, some of those assumptions become overhead. The production question is how to find the harness components a newer model no longer needs, and remove them, without rebuilding from scratch.
-
Benchmark contamination as the default risk (C5). Three of the most-cited coding benchmarks of 2024 and 2025 were saturated or compromised within 18 months of launch. Internal evaluations built on public benchmarks degrade without warning. The open problem is a contamination-resistant method that a small team can run on its own production traces, without evaluation infrastructure the size of Scale AI's.
-
Cost attribution by feature and tenant (C5). Cost per call is solved. Cost per successful task by feature, tenant or cohort is still open. The tooling has matured. Helicone reports more than 2B instrumented calls. Cloudflare documents per-user attribution through gateway metadata. OpenTelemetry graduated from the CNCF in May 2026 (CNCF, May 21, 2026), and its GenAI semantic conventions now cover LLM, agent and MCP spans. What is missing is a stable standard across systems. The GenAI conventions are still marked experimental. Attribution across a compound system with several providers is still fragile. A shared cache prefix, a hierarchical agent, or a tool that calls another agent each breaks naive attribution. In my view, the teams that solve this first will price AI features the way they now price cloud SKUs.
-
Per-task cost prediction has a variance floor (C5). Token use varies between models on the same task, and between runs of one model. Most of the variation is in reasoning (arXiv 2603.23971). Adaptive effort adds another source, because the model now decides how much to think within the level you set. Part of this variance is noise in the process itself, so no predictor removes it. The open problem is budgeting, admission control and SLA design that treat per-query cost as a distribution with a long upper tail, and that degrade predictably on the expensive queries.
I think these are the questions worth research and engineering time in 2026.
What this means for enterprise programmes
Unit prices and total bills are moving in opposite directions, and this will not reverse soon. Gartner projects that inference on trillion-parameter LLMs will be more than 90% cheaper by 2030 (Gartner, Mar 2026). But agentic models use 5 to 30× more tokens per task than chatbots, and token demand is rising faster than unit prices fall. The same Gartner note warns: "CPOs who mask architectural inefficiencies with cheap tokens today will find agentic scale elusive tomorrow."
In my view, the programmes that do well will have cost attribution for each step, disciplined evaluation harnesses, and the eighteen levers built into how they deliver. Cost is a property of the whole system, and the model you buy is one part of it.
Cost is the one factor in the realized-value equation with a clean unit, and the one whose savings multiply cleanly. The other three factors (reliability, safety and controllability) do not aggregate this way. The Reliability deep dive (Part 3) comes next: pass@always, and why it lags capability.
- 0Introduction ↗The framework. How the factors multiply.Published
- 1Capability ↗The model sets the ceiling. The system decides how much of it you get.Published
- 2CostCost per successful task.This article
- 3Reliability ↗pass@always, and why it lags capability.Published
- 4Safety ↗The agent's behaviour under uncertainty.Published
- 5Controllability ↗The operator's leverage, and where security fits.Published
1 I checked prices on each provider's own pricing page on October 31, 2026. Gemini 4 Argon prices change on December 1, 2026, and Gemini 3.8 Flash prices on January 1, 2027. Vals AI does not publish how it computes cost per test, so read cost per solved task as a comparison within one board. Verify against the References before you rely on a figure.
References
- Effective context engineering for AI agents (Sep 2025)
- Introducing Contextual Retrieval (Sep 2024)
- Building Effective Agents (Dec 2024)
- Prompt Caching docs and Pricing
- RouteLLM (LMSYS) and arXiv paper. ICLR 2025
- Kotte, V. UCCI: Calibrated Uncertainty for Cost-Optimal LLM Cascade Routing, arXiv 2605.18796 (May 2026, preprint). Lever 4.
- TensorZero. Distillation with Programmatic Data Curation
- Gartner. Inference cost predictions through 2030 (Mar 2026)
- Gartner. Over 40% of agentic AI projects will be canceled by end of 2027 (Jun 25, 2025)
- Gartner. Only 13% of CIOs say their enterprise has realized significant or transformational value from AI (Oct 19, 2026)
- FinOps Foundation. State of FinOps 2026 survey (Feb 2026) and report site
- ProjectDiscovery. How we cut LLM costs by 59% with prompt caching (Apr 2026)
- Ji, Y. Context Engineering for AI Agents: Lessons from Building Manus (Jul 2025)
- OpenHands. Context condensation for more efficient AI agents (Apr 2025). Benchmark result on a SWE-bench Verified subset.
- ZenML LLMOps Database. Cloudflare's AI-orchestrated code review, summarising Cloudflare's post.
- Osmani, A. Agent Harness Engineering (O'Reilly Radar, Apr 2026)
- LangChain. Improving Deep Agents with harness engineering. Terminal-Bench 2.0, 52.8% to 66.5%, model held fixed.
- LangChain. Tuning the harness, not the model: a Nemotron 3 Ultra playbook and NVIDIA. 0.86 versus 0.87 on the Deep Agents suite at roughly 10x lower cost per run.
- Weng, L. Harness Engineering for Self-Improvement (Lil'Log, Jul 2026)
- Anthropic. Writing effective tools for AI agents. Concise response formats cut token usage up to 65%.
- Anthropic. Code execution with MCP
- Ong et al. RouteLLM: Learning to Route LLMs with Preference Data, ICLR 2025. Lever 1.
- Chen, Zaharia, Zou. FrugalGPT, TMLR. Lever 4.
- Kwon et al. Efficient Memory Management for LLM Serving with PagedAttention, SOSP 2023. Levers 7, 15, 16.
- Zheng et al. SGLang: Efficient Execution of Structured Language Model Programs, NeurIPS 2024. Lever 7.
- Gim et al. Prompt Cache, MLSys 2024. Lever 7.
- Santhanam et al. PLAID: An Efficient Engine for Late Interaction Retrieval, CIKM 2022. Levers 6, 8.
- Dong et al. XGrammar: Flexible and Efficient Structured Generation, MLSys 2025. Lever 9.
- Jiang et al. LLMLingua, EMNLP 2023; LongLLMLingua, ACL 2024. Lever 10.
- Schick et al. Toolformer, NeurIPS 2023; Patil et al. Gorilla, NeurIPS 2024. Lever 12.
- Muennighoff et al. s1: Simple test-time scaling, EMNLP 2025. Lever 13.
- Dettmers et al. QLoRA, NeurIPS 2023; Hu et al. LoRA, ICLR 2022. Lever 14.
- Yu et al. Orca: A Distributed Serving System for Transformer-Based Generative Models, OSDI 2022. Levers 15, 16.
- Zhong et al. DistServe: Disaggregating Prefill and Decoding, OSDI 2024. Lever 16.
- Leviathan, Kalman, Matias. Fast Inference from Transformers via Speculative Decoding, ICML 2023. Lever 17.
- Chen, Zhang, He, Stoica, Zaharia, Zou. The Price Reversal Phenomenon, arXiv 2603.23971, v2 May 2026 (preprint). Levers 13, 18, and cross-cutting.
- Sivadas, S. Realized Value: A Framework for Evaluating Agentic AI in the Enterprise. Series introduction.
- Sivadas, S. Capability is a System Property. Part 1.
- Anthropic. Claude Opus 5.5, What's new in Opus 5.5, Sonnet 5.5, Haiku 5.5, Fable 5.1, Fast mode.
- OpenAI. API pricing; GPT-6.1 Sol guide; GPT-6 Sol.
- Google. Gemini Developer API pricing.
- DeepSeek. Models and pricing; change log.
- Moonshot. Kimi K3.1 Pro pricing; Kimi API pricing.
- LLM Frontier (CatalystNeuro), methodology and repository (BSD 3-Clause; data from Artificial Analysis, whose terms govern its use). Source for Figure 2, snapshot of Oct 31, 2026.
- Vals AI. Terminal-Bench 4.0 (Oct 29, 2026). mini-SWE-agent, avg@3, cost per test.
- Vals AI. Routers Are a New AI Primitive (Mahajan, Oct 14, 2026).
- Artificial Analysis. Intelligence Index v5 (Oct 27, 2026); Gemini 4 Carbon is the new #1 (Oct 28, 2026).
- Terminal-Bench 4.0 leaderboard (Snorkel, Oct 27, 2026). Vendor harnesses, total run cost.
- Schroeder, Desai, Cuadron, Zhao, Krusche, Kemper, Zaharia, Gonzalez et al. vCache: Verified Semantic Prompt Caching, ICLR 2026. Up to 12.5× higher hit rate than GPTCache baselines while satisfying a user-defined error bound; 57% hit rate at under 0.5% error in one configuration.
- Dasgupta, Banerjee et al. waLLMartCache: A Distributed, Multi-tenant and Enhanced Semantic Caching System for LLMs, ICPR 2024 (Springer LNCS 15614), Walmart Global Tech.
- Azure API Management.
llm-semantic-cache-lookuppolicy (preview). Returns cached responses by vector proximity without invoking the backend model. - AWS. Lower cost and latency using Amazon ElastiCache as a semantic cache with Amazon Bedrock. Up to 86% cost reduction at 91% answer accuracy across 63,796 queries.
- Wang et al. Category-Aware Semantic Caching for Heterogeneous LLM Workloads, arXiv 2510.26835. Hit rates by workload category; vector-DB break-even analysis.
- Zou et al. InstCache: A Predictive Cache for LLM Serving, arXiv 2411.13820. 51.3% hit rate on LMSys.
- GPT Semantic Cache: Reducing LLM Costs and Latency via Semantic Embedding Caching, arXiv 2411.05276. 61.6–68.8% hit rates.
- Portkey. Unpacking semantic caching at Walmart (Feb 2024). Summary of a talk by Rohit Chatter.
- Bang, F. GPTCache, NLP-OSS workshop at EMNLP 2023.
- Cloudflare. The AI engineering stack we built internally (2026). 10.57B tokens/day across four providers.
- Cloudflare. Powering the agents: Workers AI now runs large models (Mar 2026). 77% cost reduction on a 7B-token/day agent.
- Uber. Navigating the LLM Landscape: Uber's GenAI Gateway (2024). 60+ use cases, ~20M summaries/week.
- Qdrant. Binary Quantization. 32x memory reduction, up to 40x faster, 98% recall@50.
- Predibase. Improving Agent Feedback with Multi-LoRA at Convirza. Giuseppe Romagnuolo, VP of AI: 10x lower operational cost, +8% F1, +80% throughput.
- Notion customer story. Simon Last on prompt caching.
- vLLM. EAGLE 3.1 and Snowflake Arctic Inference. Speculative decoding in production.
- Helicone. Cost tracking; OpenTelemetry GenAI observability.
- Princeton HAL. Holistic Agent Leaderboard (ICLR 2026, arXiv 2510.11977). Pareto frontiers across nine agent benchmarks in the paper
- HAL Reliability Dashboard. Consistency, robustness, safety, abstention
- Aider Polyglot Leaderboard and Epoch AI mirror
- Berkeley Function Calling Leaderboard (BFCL v4) and paper
- MTEB / MMTEB leaderboard
- Sierra τ-bench / τ2-bench
- AgentDiet. Reducing Cost of LLM Agents with Trajectory Reduction (PACMSE FSE 2026, arXiv 2509.23586). 39.9–59.7% input-token reduction, no quality loss.
- The Decoder. First token counts reveal Opus 4.7 costs more than 4.6 (2026). Reports Anthropic's 1.0–1.35× tokeniser figure.
- CNCF. OpenTelemetry graduation (May 21, 2026)