Realized Value: A Framework for Evaluating Agentic AI in the Enterprise
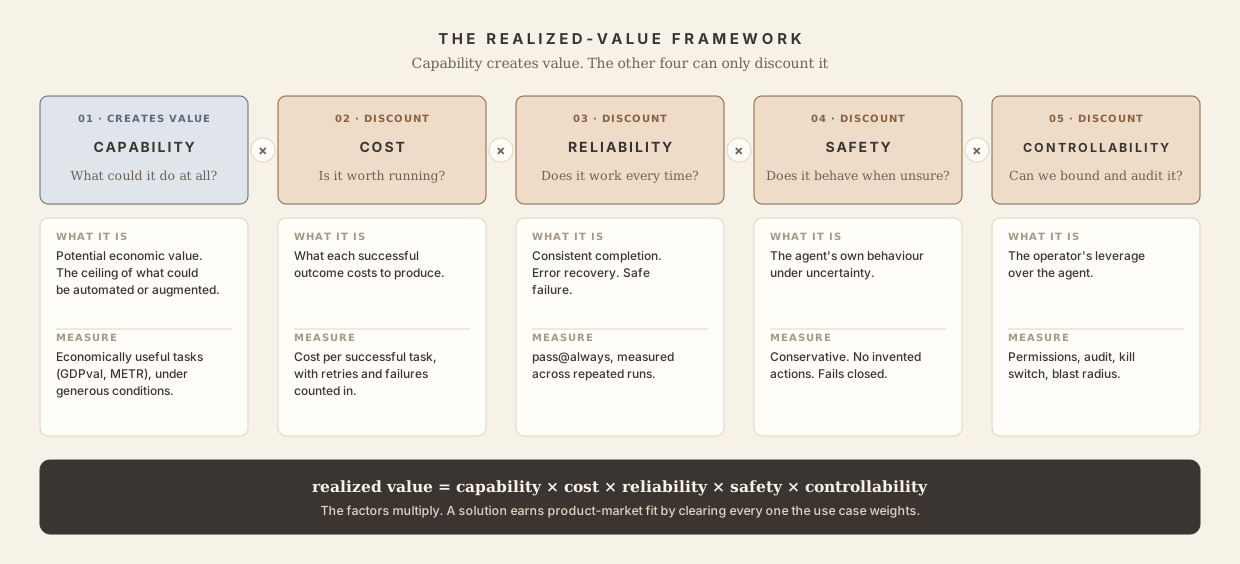
Capability is the only term that creates value. Everything else is a discount. The binding constraint is whichever factor sits closest to zero, usually one of the other four.
My team and I work with enterprises across industries. We talk to the users who stand to gain from agentic AI. We build the tooling layer beneath these solutions. And we follow each advance in LLM capability and the shifts in value across the stack.
This series is my attempt to write down what we keep seeing. Frontier capability is growing fast. Investment and market value are growing with it. Yet most enterprises still struggle to put agentic AI into production. That gap is the subject of these articles.
What GDPval says
In September 2025, OpenAI released GDPval. It is 1,320 tasks across 44 occupations, drawn from the nine sectors that contribute most to U.S. GDP and about $3 trillion in annual wages. Each task is a real deliverable: a financial model, a legal review, a consulting report. A professional with about 14 years of experience built each one. Each took roughly seven hours. Experts then judged the model outputs blind, marking each as better than, equal to, or worse than the human's (Patwardhan et al., 2025).
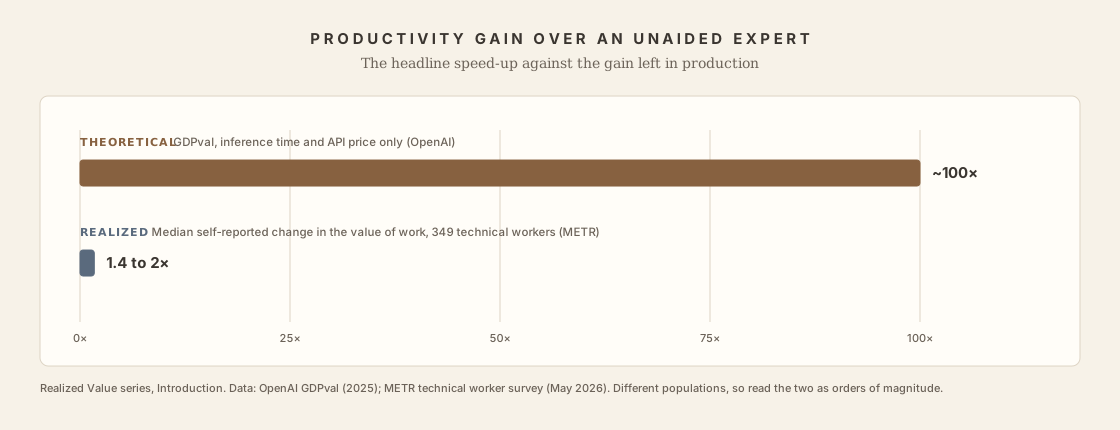
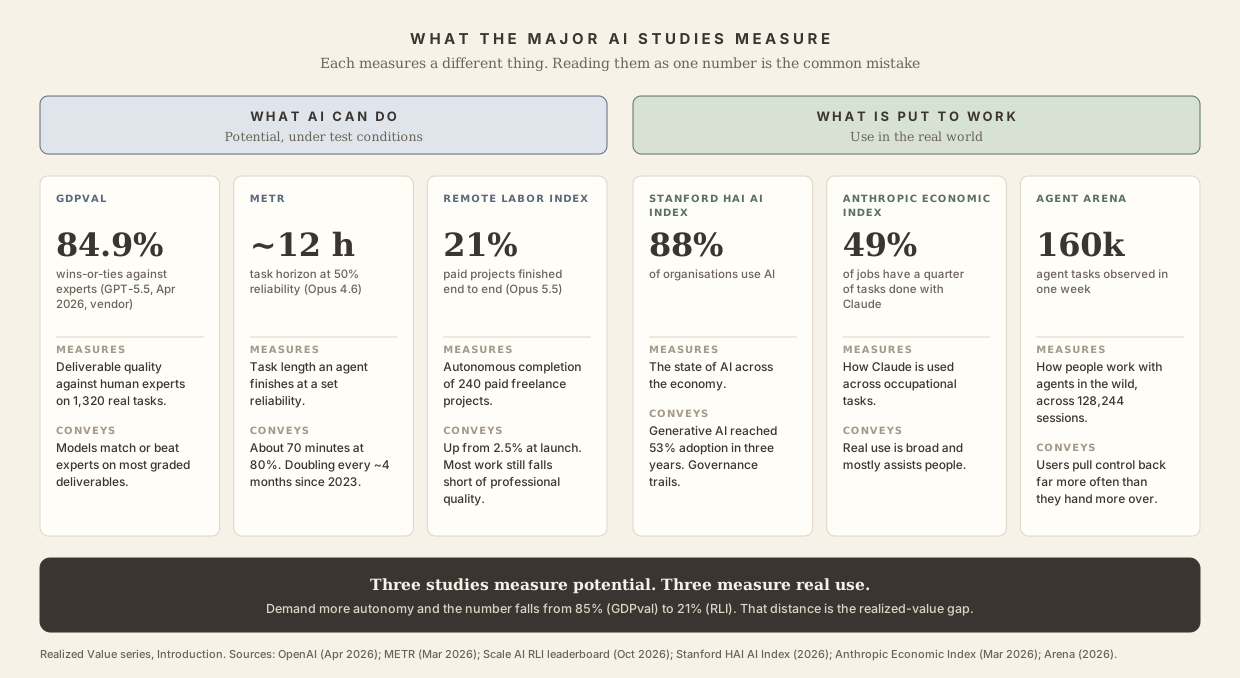
At the September 2025 release, Claude Opus 4.1 led at 47.6% wins-or-ties against the human expert on the 220-task gold subset (Patwardhan et al., 2025). By April 2026, OpenAI reported GPT-5.5 at 84.9% (OpenAI, 2026). Artificial Analysis now runs an independent version, GDPval-AA, where Claude Opus 5.5 leads as of October 2026 (Artificial Analysis, 2026). OpenAI puts the models at roughly 100× faster and 100× cheaper than the experts. That figure counts inference time and API billing alone, and leaves out oversight, iteration, and integration (OpenAI, 2025).1
That is what GDPval says: the capability already exists for a large share of valuable knowledge work.
What translates
Now set that against a second number. Gartner expects over 40% of agentic AI projects to be cancelled before production by 2027. The drivers are cost and complexity (Gartner, 2025). Gartner's 2026 CIO and Technology Executive Survey (cited in its first Hype Cycle for Agentic AI) makes the deployment picture clearer: 17% of organisations have deployed agents, and over 60% expect to within two years (Gartner, 2026).
Both numbers are true at once. The gap between them is this series. Production adds what the benchmark ignores. A human reviews the output. Someone reworks it when it's wrong. The agent costs money at volume. Controls keep it safe and contained. Count all of that and the advantage shrinks. METR's survey of 349 technical workers found a median self-reported 1.4 to 2× change in the value of their work (METR, 2026). METR itself cautions that self-reports may not match reality. The two figures also cover different populations, so read them as orders of magnitude. The distance between 100× and 2× is the point.
A third measure takes the human out entirely. The Remote Labor Index, from Scale AI and the Center for AI Safety, scores end-to-end autonomous completion of real freelance projects. 240 paid projects, over $140,000 of real work. At launch in October 2025 the best agent finished 2.5% of them at acceptable quality. By July 2026 the leader reached 15.8%. By October, Claude Opus 5.5 led at 21.25%, an eightfold rise in a year (Scale AI and CAIS, 2025; CAIS, 2026; Scale, 2026). The absolute number stays low. CAIS finds today's agents still fall short of professional quality on most projects.
Agents' Last Exam (Berkeley RDI and Snorkel AI) is harder still. It sets 1,500 long professional workflows across 55 fields and grades the final deliverable with code verifiers where it can. On its hardest tier, frontier models fully pass under 1% of tasks (Berkeley RDI and Snorkel AI, 2026).
These numbers measure different things. They sit on an autonomy spectrum. GDPval grades a single deliverable against an expert. The 1.4 to 2× gain assumes a human in the loop. RLI removes the human and asks for a finished project. Read together they tell one story. High deliverable quality. A modest gain with a person reviewing. Roughly one project in five finished on the agent's own, up from almost none a year ago.
GDPval measures a ceiling. The enterprise lives in the gap between that ceiling and the 1.4 to 2×. Capability is what the benchmark shows. Value is what's left in production. Ethan Mollick calls this gap the overhang: the distance between what models can do and what almost anyone does with them (Mollick, 2026). He traces it to how people use the models. In an enterprise, four things govern it: cost, reliability, safety, and controllability.
The benchmark builders now name this gap themselves. Stanford's 2026 Index highlights the distance between what models can do and how ready organisations are to govern them (Stanford HAI, 2026). METR finds agents do worse on messier tasks, and notes that most jobs are messier than its task suite (METR, 2026). Agent Arena (160,480 agent tasks across 128,244 real-world sessions in one week) finds users pull control back far more often than they hand more over (Arena, 2026).
The series asks one question. How much of the model's capability is left once it reaches production?
The mental model
This is a mental model. It guides judgement about which factor binds. The shape is simple:
capability
× cost
× reliability
× safety
× controllability
Only cost has a clean unit, the dollar. The other terms resist a single honest number. The model reveals what a scorecard hides: the factors multiply, so one near-zero factor zeros the product.
Capability is the only term that creates value. The other four can only discount it. An agent with high capability and zero controllability ships nothing. An agent you can't afford, trust, or audit is worth nothing, whatever the first term reads. The factor nearest zero sets the outcome.
How much each factor matters depends on the use case and the sector. The same model on the same task carries different weights. What changes is the cost of error. Three versions of one tool show this.
- A meeting-notes summariser for internal standups. A human always reviews the output. Mistakes surface in seconds. The content stays inside the organisation. Safety and controllability barely register. Cost and reliability decide if it is worth running.
- The same summariser on patient charts or audited financial filings. Now a dropped contraindication or an invented figure is a clinical or regulatory incident. Safety and reliability move to the front. The deployment needs rigorous safety testing before it ships. Same model, same capability. The weights inverted because the stakes did.
- An agent that places trades or submits orders. Controllability leads: permissions, reversibility, blast radius, a human in the loop on anything irreversible. Even a capable, low-cost, accurate model ships only when you can bound what it does when it is wrong.
Weights follow consequences. A summariser is low stakes only until you point it at something that matters. These weights are judgement calls, set by the deployment. The framework points at one question: which factor is your binding constraint, in your sector. The Capability deep dive sets out how the weights are set, and each later part shows how its factor's weight shifts with the stakes.
How the factors determine the outcome
Capability enters as potential, the ceiling that GDPval and METR measure. Each discount factor is a gate. What leaves the last gate is realized value: what ships, and what the usage data later records.
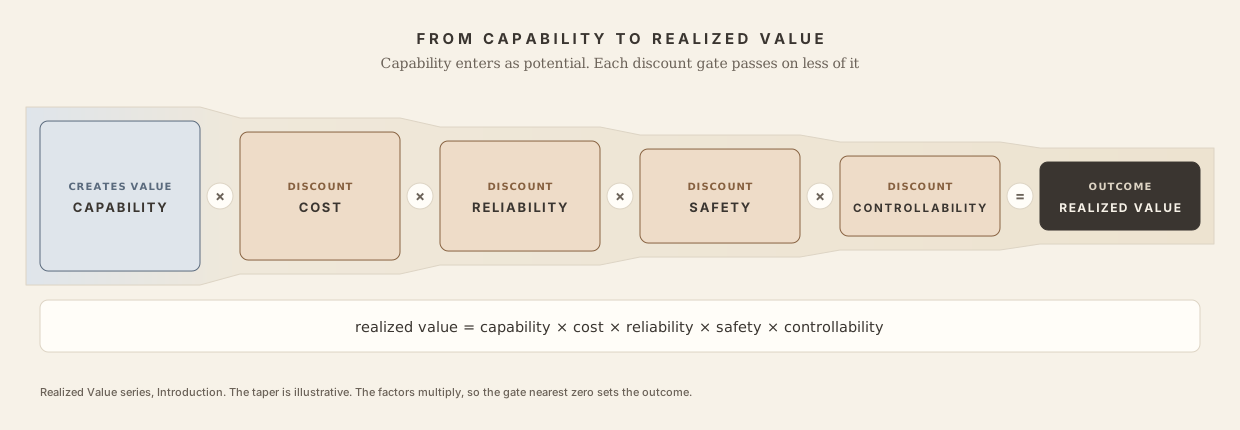
One factor near zero leaves an expert-level model with almost no value. The opening question is which factor binds. The model sets the ceiling. Your binding constraint sets the rest.
Capability: the ceiling
Capability is the potential economic value, the ceiling of what could be automated or augmented. The discipline is in how you measure it.
Measure it on economically useful tasks: GDPval-style occupational work (Patwardhan et al., 2025), METR-style autonomy horizons (METR, 2026). Abstract benchmarks like MMLU measure something different. Measure it under generous conditions: best effort, ideal harness, no time pressure. That keeps the number a clean ceiling. Measure it at a success-rate threshold instead and you fold reliability into the top line, then double-count it later. METR shows this. Claude Opus 4.6 has a task horizon near 12 hours at 50% reliability. At 80% it drops to about 70 minutes. The same model's capability falls by an order of magnitude. Only the reliability bar changed (METR, 2026). METR corrected the 50% figure down from about 14.5 hours in March 2026. It flags measurements above 16 hours as unreliable on its current suite, and stopped updating the tracker in September 2026. Newer models are beyond what the suite can measure reliably, so Opus 4.6 is still the cleanest example.1
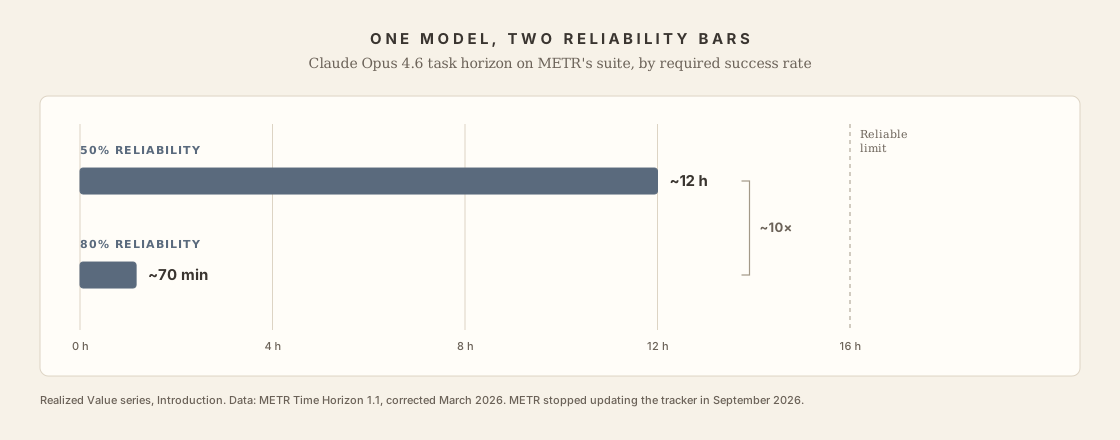
Two consequences. First, capability is a system property, emerging from the model and its harness. Below the flagship tier, the harness is usually the first thing to work on. Mollick sees the opposite trend: as models improve, they organise their own work, and hand-built harnesses matter less (Mollick, 2026). For raw task performance, he's likely right, and by October 2026 the benchmark data showed it for flagship models (Capability deep dive). In an enterprise the harness also carries permissions, integrations, and audit, and those stay the operator's job. Second, adoption sits downstream of capability. The Anthropic Economic Index tracks what people use agents for. That is the product of all five terms, an output read after the fact (Anthropic, 2026).
The full argument, with the October 2026 evidence, is in the first deep dive: Capability is a system property.
The four discounts
Each one multiplies. Each cuts potential down to what actually deploys.
A note on security. It sits across safety and controllability. Adversarial resistance is a different threat model from the agent's behaviour or the operator's controls.
A note on integration complexity
Real agents work across many systems: CRM, ITSM, SharePoint, email, and more. Integration complexity changes the weights on the factors you already have, unevenly.
- Reliability takes the largest hit. Every system is a new failure surface. APIs rate-limit. Tokens expire. Schemas change. An agent chained across five systems is only as reliable as its flakiest dependency, and failures compound across steps. OSWorld 2.0 tests this directly: 108 workflows spanning several applications (about 1.6 hours each for a person). In June 2026 the best agent (Opus 4.8) completed 20.6% (OSWorld 2.0, 2026). Claude Opus 5 now leads the leaderboard at 44.3% (Snorkel), on a revised task set. The same model scored 31.4% on the August release, so part of that rise comes from the benchmark.
- Cost rises next. Tool schemas sit in context on every call. More systems mean more calls and more retries per task.
- Controllability gets harder. Each connection is a new permission scope, a new blast radius, and a new audit trail.
- Capability sets a floor. The agent must operate each tool correctly. This is rarely where the deployment fails.
One part falls outside the model. Cost per successful task is an operating cost. Building and maintaining connectors is a fixed cost. It sits in total cost of ownership, and realized value must amortise it. A small per-task cost can rest on a large integration bill.
So high integration complexity raises the weights on reliability, cost, and controllability, whatever the task looks like on its own.
A successful solution addresses all of them
This is the core of what I've learned. A successful agentic solution addresses every factor. That is product-market fit here.
The reason is the multiplication. A solution strong on capability and weak on controllability doesn't ship. One weak factor pulls the whole product down. So fit means clearing every factor the use case weights.
The adopter cares about all of them at once. Inside the organisation, different teams gate different pillars. Finance looks at cost. The CISO looks at controllability and security. Governance and risk look at safety. Product and engineering look at capability and reliability. Each team can block the solution on its own factor. A solution earns fit only when it answers all of them.
Honest limits
This framework is a diagnostic tool. It finds your binding constraint.
- The factors trade off. Cutting cost can cost capability. Tighter controllability can cost latency. A more conservative safety posture can cost capability at the margin.
- Only cost aggregates cleanly. You can multiply a routing saving by a caching saving and the math holds. Safety and controllability resist that arithmetic.
- It points at where to look. Finding the binding constraint starts the work, and directs effort at the factor holding realized value down.
- The instruments have limits of their own. Automated graders inflate scores on newer models. In July 2026, CAIS calibrated an LLM judge on older systems, then applied it unchanged: it overstated GPT-5.5 by about 2.9× and Opus 4.8 by about 2.3×, while still ranking models correctly. OpenAI's own GDPval grader agrees with human experts 66% of the time, against 71% between experts (CAIS, 2026). Benchmarks that grade with code, such as Agents' Last Exam, avoid part of this problem.
- Time-horizon reasoning works poorly outside software. On RLI's spread of remote work, success rates stay flat as human completion time rises, so the horizon model fits the data badly. Treat the METR figure as a measure of software and ML work specifically (CAIS, 2026).
The series
Five deep dives. Each pins its claims to named evidence and calls out the traps.
- 0IntroductionThe framework. How the factors multiply.This article
- 1Capability ↗The model sets the ceiling. The system decides how much of it you get.Published
- 2Cost ↗Cost per successful task.Published
- 3Reliability ↗pass@always, and why it lags capability.Published
- 4Safety ↗The agent's behaviour under uncertainty.Published
- 5Controllability ↗The operator's leverage, and where security fits.Published
Capability sets the ceiling. The other four decide how much of it you keep.
References
- Patwardhan et al. GDPval: Evaluating AI Model Performance on Real-World Economically Valuable Tasks (arXiv 2510.04374, Oct 2025). OpenAI announcement (Sep 2025). Introducing GPT-5.5 (Apr 2026), 84.9% wins-or-ties. GDPval-AA, Artificial Analysis, independent Elo ranking.
- METR. Measuring AI Ability to Complete Long Tasks (Mar 2025). Time Horizon 1.1 (Jan 2026). Task-Completion Time Horizons, corrected March 2026, no longer updated since September 2026. Self-Reported Impact of Early-2026 AI on Technical Worker Productivity (May 2026).
- Scale AI and Center for AI Safety. Remote Labor Index (arXiv 2510.26787, Oct 2025). Autonomous completion of real freelance work; 2.5% best-agent automation rate at launch. Scale leaderboard, 21.25% best-agent rate as of October 2026. Updated results: A Significant Increase in Digital Labor Automation (CAIS, Jul 2026), 15.8% best-agent automation rate, plus findings on automated-grader inflation and the limits of time-horizon analysis.
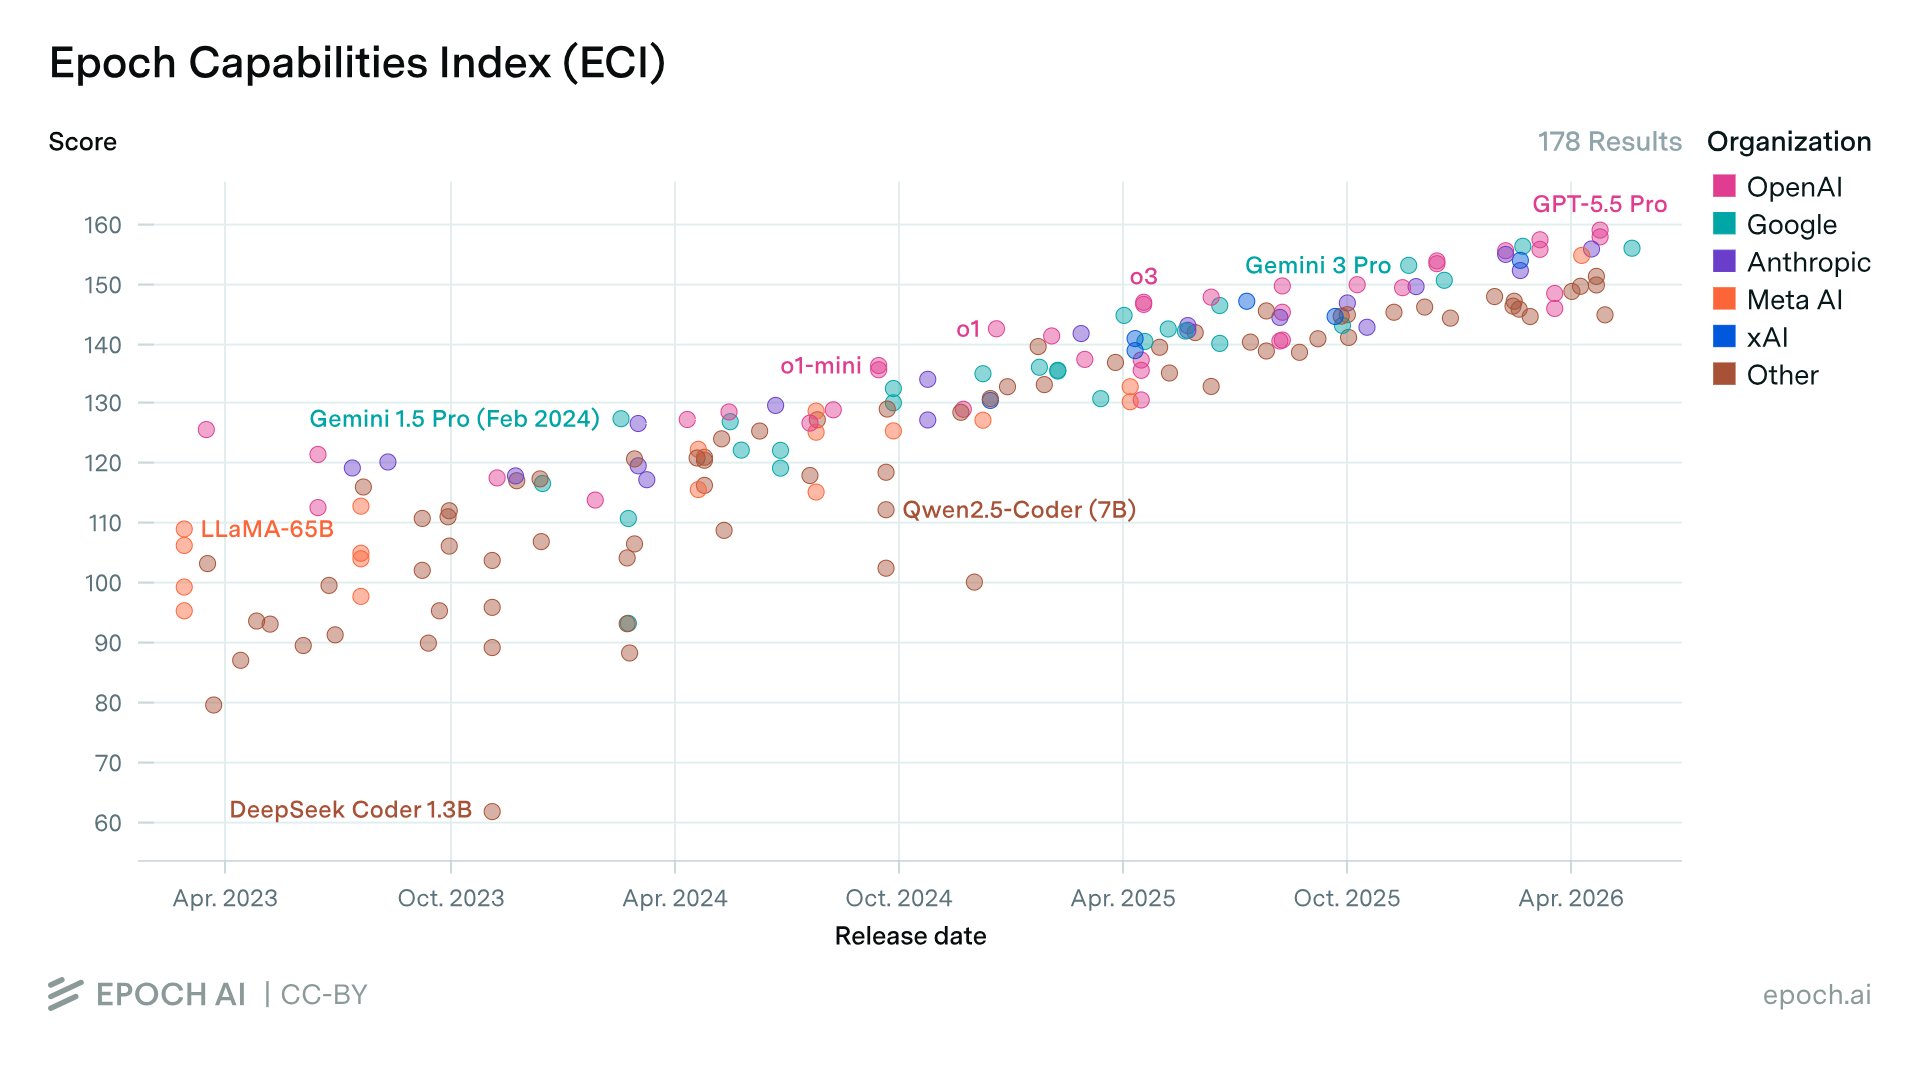
- Lee and Emberson. Epoch Capabilities Index (Epoch AI, live since Oct 2025). Composite capability scale stitching dozens of benchmarks. Methodology paper: A Rosetta Stone for AI Benchmarks (arXiv 2512.00193).
- Mercor. APEX-Agents (arXiv 2601.14242, Jan 2026). 480 professional-services tasks; pass@1, pass@8, and pass^8. Announcement. APEX-Agents 1.1, a revised 240-task set, followed in September 2026 (Mercor blog).
- Berkeley RDI and Snorkel AI. Agents' Last Exam (arXiv 2606.05405, Jun 2026). 1,500 workflows across 55 fields, code-verified grading where possible.
- OSWorld 2.0: Benchmarking Computer Use Agents on Long-Horizon Real-World Tasks (arXiv 2606.29537, Jun 2026). 108 cross-application workflows.
- Snorkel AI and XLANG Lab. OSWorld 2.0 leaderboard (checked Oct 31 2026). Claude Opus 5 leads at 44.3%.
- Anthropic. Introducing the Anthropic Economic Index (Feb 2025). Economic Index report, March 2026, 49% of jobs with at least a quarter of tasks performed using Claude. Economic Index report, June 2026.
- Stanford HAI. The 2026 AI Index Report. AI Index overview.
- Gartner. Over 40% of Agentic AI Projects Will Be Canceled by End of 2027 (Jun 2025). Industry cancellation projection. Hype Cycle for Artificial Intelligence (2026), citing the 2026 CIO and Technology Executive Survey: 17% deployed, over 60% planning to deploy within two years.
- Arena Team. Agent Arena: Causal Evaluation of Agents in the Real World (Jun 2026). Causal methodology on 160,480 agent tasks across 128,244 real-world sessions; reining-in, bluffing, bluster, cost-vs-performance Pareto.
- Ethan Mollick. The Overhang (One Useful Thing, Sep 2026). The Dot and the Swarm (One Useful Thing, Oct 2026).
1 All figures were retrieved and last verified in October 2026. Several move quickly, notably GDPval scores, the Remote Labor Index rate (2.5% in October 2025, 21.25% in October 2026), APEX-Agents scores, and the Epoch index. METR corrected its Opus 4.6 horizon in March 2026 and stopped updating its tracker in September 2026. Verify against the primary sources in the References before republishing.