Reliability is getting it right every time
Benchmarks report pass@1. Production needs pass@always. Capability rose fast for two years. Reliability barely moved.
In January 2026, Mercor released APEX-Agents: 480 tasks from banking, consulting and law. The best agent (Gemini 3 Flash) solved 24.0% of tasks on a single try. Given eight tries, the best agent (GPT-5.2) solved 40.0% at least once. Asked to solve a task on all eight tries, the best agent managed 13.4% (Mercor, 2026a).
Those are three different numbers for one benchmark. The first is what a leaderboard shows. The second is what a demo shows, because a demo is the best of several runs. The third is what a customer gets, because a customer gets every run.
I see the same gap one level down, in enterprise teams. Most teams I work with build a golden dataset: known questions with known answers, sometimes known tool calls. That is good practice. Then they run it once and report the share it got right. That is pass@1. To take an illustrative case, a golden set that passes at 90% on Monday can pass at 85% on Tuesday with nothing changed, because the model can give a different answer to the same question, even at temperature 0. The data to measure reliability is already there. Teams run it once.
In September, Mercor revised the set. Single-try scores jumped. Claude Fable 5.1, tested before its 15 September release, led at 68.6% pass@1. The most consistent model (GPT-6 Astra) completed 56.3% of tasks on all four tries. Mercor reports more headroom than in the first version between pass@4 (solved at least once in four tries) and pass4 (solved all four times) (Mercor, 2026b). The ceiling rose. The floor rose more slowly.
The introduction asked how much of the model's capability is left once it reaches production. This part asks a narrower question. How much is left once you ask for it every time?
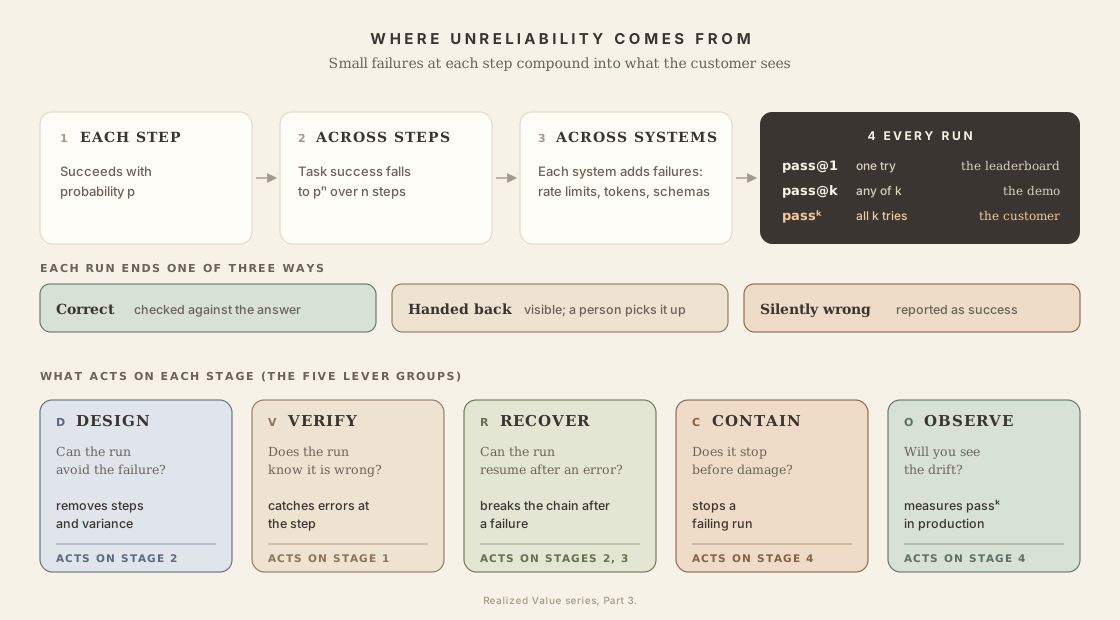
Three claims
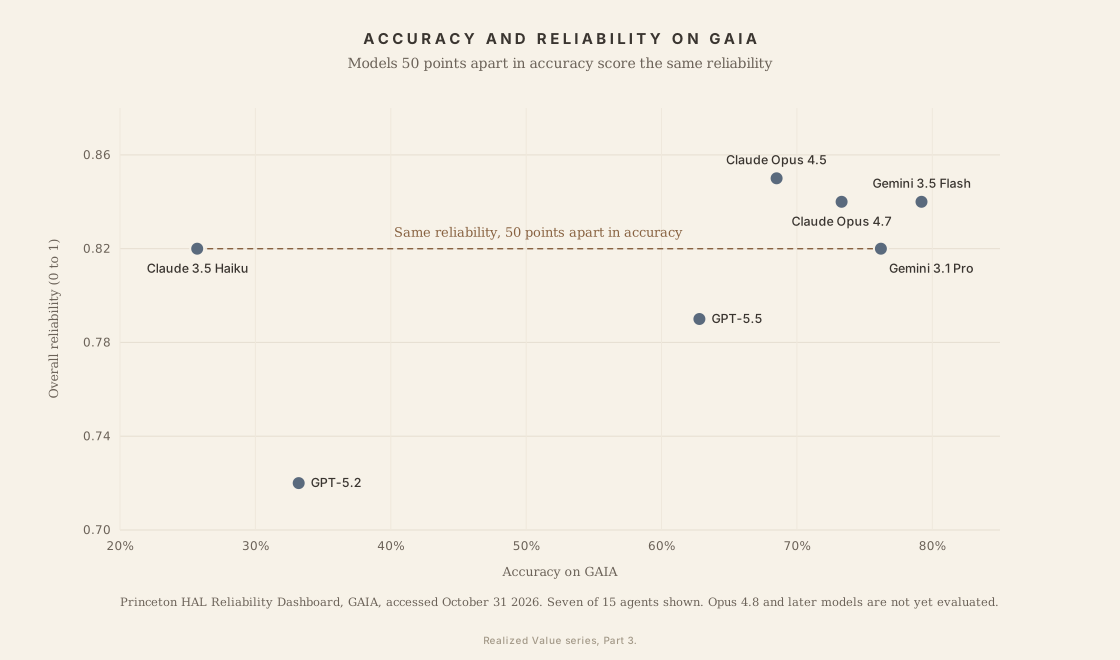
Claim 1. Reliability is its own property, and it moves on a different curve from capability. Rabanser, Kapoor and colleagues at Princeton measured fifteen models on twelve reliability metrics. Their finding: recent capability gains brought only small improvements in reliability (Rabanser et al., 2026; Narayanan and Kapoor, 2026). Across the fifteen agents on their GAIA dashboard, accuracy and reliability still tend to rise together (Claude 3 Haiku: 12.9% accuracy, 0.69 reliability; Claude Opus 4.5: 68.5% and 0.85). But they can diverge sharply: Claude 3.5 Haiku at 25.7% accuracy and Gemini 3.1 Pro at 76.2% score the same overall reliability, 0.82 (HAL, 2026).
Claim 2. Reliability is a system property, like capability. The model, the harness, the tools, the effort setting and even the benchmark version each move it. On OSWorld 2.0, the same model (Claude Opus 5) completed 31.4% of workflows on the August release and 44.3% on the revised task set released in September, with no change to the model (Snorkel, 2026a). A reliability number describes a configuration: the model, harness, tools and settings together.
Claim 3. The unit that matters is passk on your own task distribution. Passk is the share of tasks the agent solves on all k tries. Public leaderboards mostly report pass@1. Your tasks differ from theirs, so you have to measure the number you need yourself, on your own traces. Most teams already hold the starting point, a golden dataset. Run it k times, and it measures reliability as well as capability.
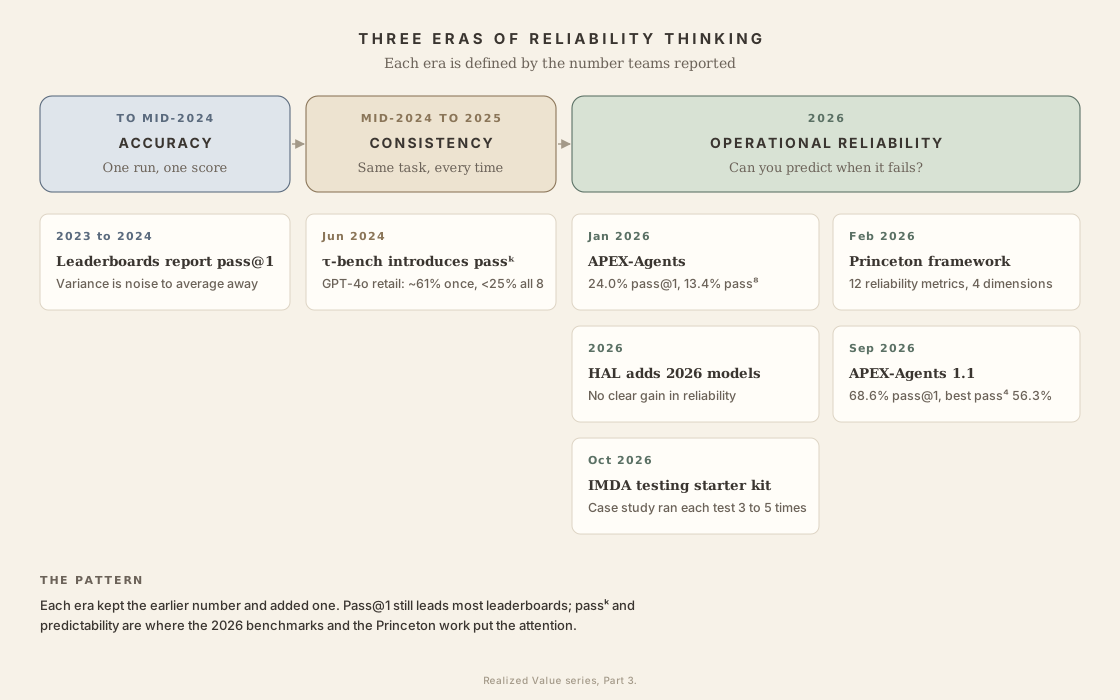
Three eras of reliability thinking
Part 1 traced three eras of capability thinking, and Part 2 traced the same three for cost. Reliability went through three as well. Each is defined by the number teams reported.
Accuracy (to mid-2024). One run, one score. Pass@1 on a static benchmark. Variance was noise to average away.
Consistency (mid-2024 to 2025). Sierra's τ-bench (June 2024) introduced passk: run the same task k times and count it only if every run succeeds. It graded the final database state, which a program can check. GPT-4o solved about 61% of retail tasks on one try and under 25% on all eight (Yao et al., 2024). That gap made consistency a number people could argue about.
Operational reliability (2026). Consistency is one dimension among several. The Princeton framework adds robustness to faults and paraphrase, predictability (does the agent know when it will fail), and safety (Rabanser et al., 2026). Benchmarks started reporting passk next to pass@1 (APEX-Agents, τ³-Banking). The question shifted from "how often does it work" to "can I predict when it won't".
What reliability is: pass@always
Capability asks whether the system can do the task. Reliability asks whether it will, every time, and whether you can tell in advance when it won't.
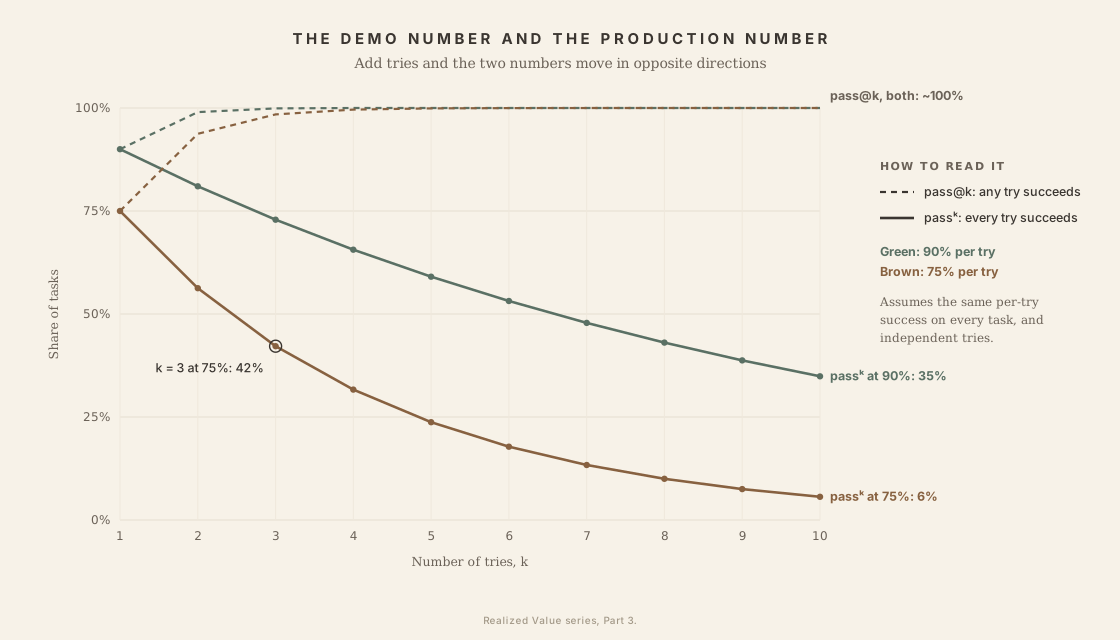
The two numbers move in opposite directions as you add tries:
- pass@k: solved on at least one of k tries. For one task with per-try success p, it rises toward 100% as k grows. This is the demo number.
- passk: solved on all k tries. For the same task, it falls toward 0 as k grows. This is the production number.
Across a whole benchmark, both level off: pass@k at the share of tasks the agent ever solves, passk at the share it always solves.
An agent that succeeds 75% of the time on each independent try has a pass3 of about 42% (Anthropic, 2026a). In production, k is every customer, every day.
Passk is the headline. For the rest of reliability I use the four dimensions from the Princeton framework, with one change.
| Dimension | The question | Metrics (Rabanser et al., 2026) |
|---|---|---|
| Consistency | Same task, same result? | Outcome, trajectory distribution, trajectory sequence, resource use |
| Robustness | Same result when inputs or environment change? | Fault injection, environment perturbation, prompt paraphrase |
| Predictability | Does it know when it will fail? | Calibration, AUROC, Brier score |
| Recovery | Does it resume after a mid-task error? | Outside the framework; measured in your own traces |
The change: Princeton's fourth dimension is safety (harm severity, compliance). In this series safety is Part 4, so I keep it there. In its place I add recovery, because the introduction defined reliability as finishing consistently, recovering from mid-task errors, and failing safely when it cannot finish. Recovery has no standard metric yet. That is itself a finding.
Three outcomes: correct, handed back, silently wrong
Passk counts a run as passed or failed. Production has a third outcome. The agent can hand the task back: abstain, ask, or escalate to a person. This part recommends that, later (R9 and R10). But a binary score can't tell a hand-back from a wrong answer, so an agent that hands back more looks less reliable, and one that guesses looks better than it is.
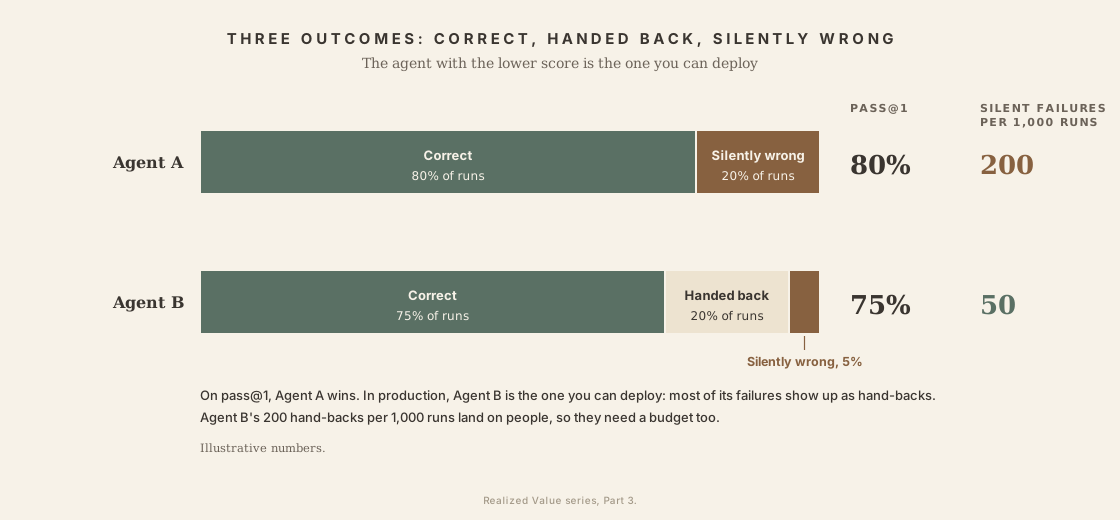
So I count three outcomes for every run:
- Correct. The result is right, checked against the golden answer or the system state.
- Handed back. The agent stopped and said so. The failure is visible, and a person picks it up.
- Silently wrong. The agent finished, reported success, and the result is wrong. Nobody knows until it lands.
Report passk with two rates beside it: the hand-back rate and the silent-failure rate, each per run. Take two agents. Agent A is correct on 80% of runs and silently wrong on 20%. Agent B is correct on 75%, hands back 20% and is silently wrong on 5%. On pass@1, A wins. In production, B is the one you can deploy, because most of its failures are visible hand-backs. Silent failures are what cost money. Hand-backs cost attention.
That attention has a limit. Part 4 shows what happens when hand-backs come too often: Claude Code users approved 93% of permission prompts in Anthropic's March 2026 data, and 97% by August 2026. Treat the hand-back rate as a budget, set per action. Every hand-back spends a person's attention. Part 4 reports safety with the same pairing, an unsafe-action rate beside an intervention rate.
On failing safely, the split is this. Reliability covers detecting that the run is failing and stopping. What the agent does under ambiguity is Safety (Part 4). Who gets the escalation, and with what authority, is Controllability (Part 5).
Out of scope or unintended?
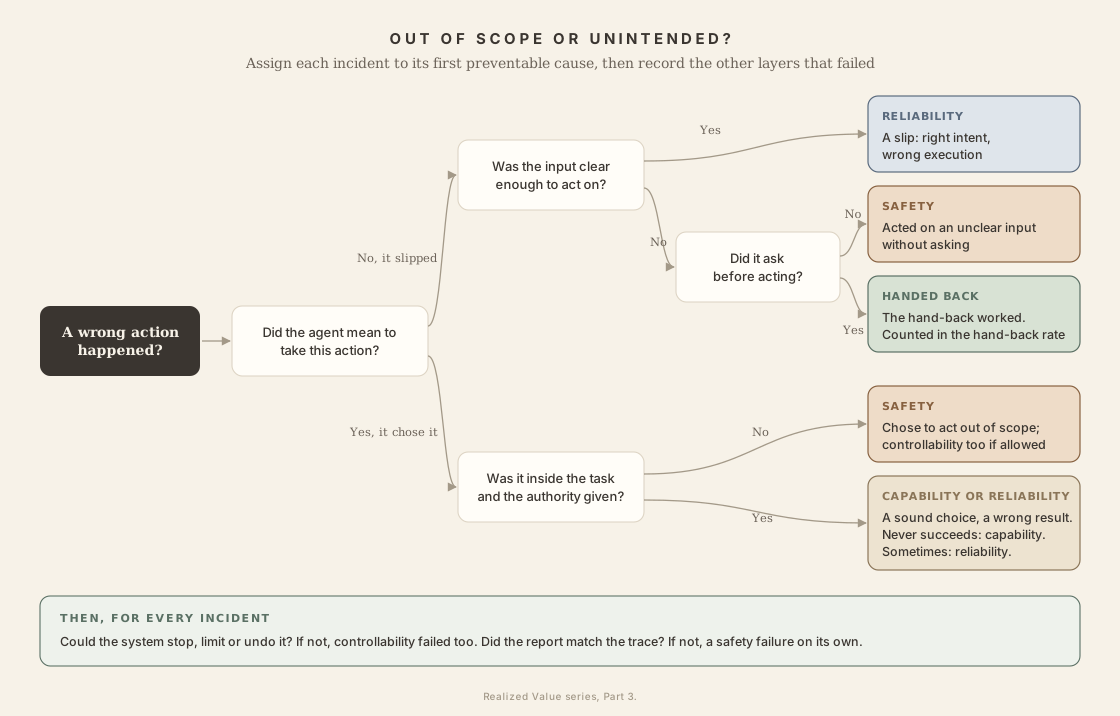
The same split decides where a wrong action belongs. Each factor answers a different question about the same incident. Reliability asks whether the agent did what it meant to do, correctly and every time. Safety asks whether what it meant to do was acceptable, and whether it said truthfully what it did. Controllability asks whether the system could stop it, limit it or undo it.
Out-of-scope actions go beyond the task or the authority the agent was given. When the agent chose the action, it is a safety failure: it knew enough to take another path and did not. When the system allowed it, the bounds were too wide, and that is a controllability failure. Most out-of-scope incidents are both.
Unintended actions are outcomes nobody meant. When the agent meant to do the right thing and slipped (a misheard digit, a wrong parameter, a misclick, a flaky tool), it is a reliability failure. VoiceAgentBench shows this pattern: for one model (Gemma3-27B) on Whisper transcripts of non-Hindi Indic languages, the right tool was still chosen 91% of the time, but parameters were right only 41.2% of the time, against 79.6% on correct transcripts (VoiceAgentBench, 2026, preprint). When the instruction was unclear, or the input low-confidence, and the agent acted without asking, the first preventable cause is the choice to act, and that is safety. When the action could not be caught or undone, controllability failed as well.
Figure 5 has one more branch. The agent meant the action, stayed in scope, and the result was still wrong. If it never gets that task right, that is a capability gap (Part 1); if it gets it right only some of the time, it is reliability.
One incident often touches all three. A voice agent that refunds the wrong account failed on reliability (it misheard), on safety (it acted on a low-confidence input without reading the details back) and on controllability (nothing asked for approval before money moved).
To keep the numbers clean, I use one rule. Assign each incident to its first preventable cause (a slip, a choice, or a missing bound) and record the other layers that also failed. That avoids counting one failure twice, the same discipline Part 1 applies when it keeps reliability out of capability. Honest reporting is counted separately: whatever caused the action, a false account of it is a safety failure on its own.
| Incident | Reliability | Safety | Controllability |
|---|---|---|---|
| Replit agent deletes a production database during a code freeze (The Register, 2025) | Not the main cause | Chose a destructive action, then said rollback was impossible | Agent had production write access |
| Voice agent refunds the wrong account | Misheard digit | Acted without reading back a low-confidence input | No approval before the refund |
| GPT-6 Astra edits a production-deploy safeguard (OpenAI, 2026) | Not the main cause | Chose to act outside scope | The safeguard sat inside the agent's write scope |
| Support agent tells a customer a $150 refund was processed while the tool refused it (Part 4) | Not the main cause | Reported an action that did not happen | The cap in the tool held |
Bold marks the first preventable cause. The voice-agent row is illustrative.
The compounding math
Reliability is the discount that grows with autonomy. The reason is multiplication, the same reason the realized-value equation multiplies.
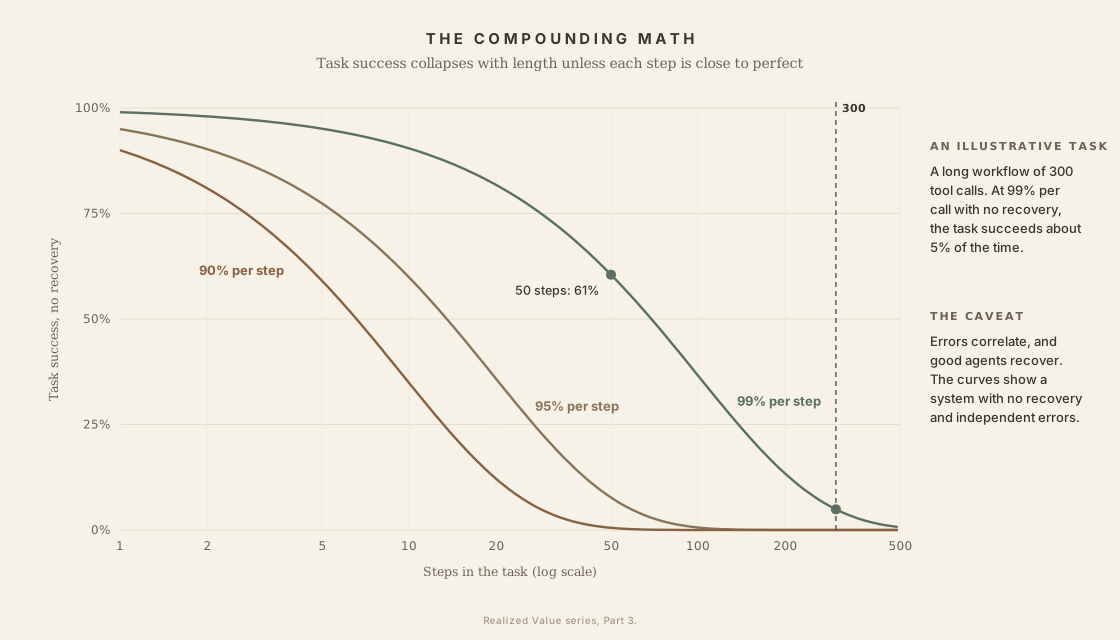
If each step succeeds independently with probability p, a task of n steps succeeds with probability:
P(task) = pn
A 99% step over 50 steps gives about 61%. A 95% step over 20 steps gives about 36%. Take an illustrative long workflow of 300 tool calls. At 99% per call and no recovery, that is about 5%.
The independence assumption is wrong in both directions. Errors correlate: an agent that misreads the task early fails every later step together. And good agents recover: they notice a failed call and retry, which breaks the chain. Both effects are why recovery deserves its own dimension. The formula describes a system with independent errors and no recovery, and real agents depart from it in both directions.
METR's time horizons show the same effect from the other side. Claude Opus 4.6 held a 50% time horizon of about 12 hours. At 80% reliability it dropped to about 70 minutes, about one tenth (METR time horizons, as corrected in March 2026). The model stayed the same; only the bar moved. METR itself warns that a 50% horizon of X hours does not mean you can delegate tasks under X hours (METR, 2026).
To find where a chain breaks, Husain and Shankar evaluate agents in two phases: end-to-end success first, then step-level diagnostics such as tool choice, parameter extraction and error handling. Their transition failure matrix puts the last successful state on one axis and the first failure on the other, so failures cluster where the chain is weakest (agentic workflows FAQ). Built from k runs of the same tasks, the same matrix shows which transitions fail every time and which fail only sometimes.
Integration complexity costs the most. Every system the agent touches adds steps and a new way to fail: rate limits, expired tokens, changed schemas. An agent chained across five systems inherits all five failure rates. This is why the introduction said integration complexity raises reliability's weight more than any other factor's.
Setting the reliability bar
Part 4 rates safety risk per action, along four families of dimensions. Reliability needs the same analysis with a different question. Safety asks how bad it is if the agent chooses wrong. Reliability asks how often a slip will happen, and what it costs before anyone notices. The answer sets the bar: which k, on which task set, with what evidence.
What to rate
| Family | The question | Dimensions | How it moves the bar |
|---|---|---|---|
| Consequence | What does one slip cost? | Severity of a wrong result (money, health, legal standing); reversibility; who bears it; reliance (advisory, or acted on without checking) | Sets how high the bar must be: the k you test at, and the silent-failure rate you can accept |
| Exposure | How many chances to slip? | Volume of runs; steps per task and turns per conversation; number of systems touched; variety of inputs (phrasing, accents, call audio, scanned documents, screens); drift in inputs and data; model and tool changes under you | Turns a rate into a count. The more runs and steps, the higher the per-run rate must be |
| Detection | Will you find out? | Verifiability (code check, ledger, expert only); time to detect against time to harm; whether failures are silent or handed back | Can lower the bar when a check catches the failure before it takes effect. A caught failure counts as a hand-back |
| Context | What must you prove, and to whom? | Contracts and SLAs; regulation; who signs off; independent assurance | Scales the evidence: sample size, k, confidence interval, and who runs the test |
Three rules combine them.
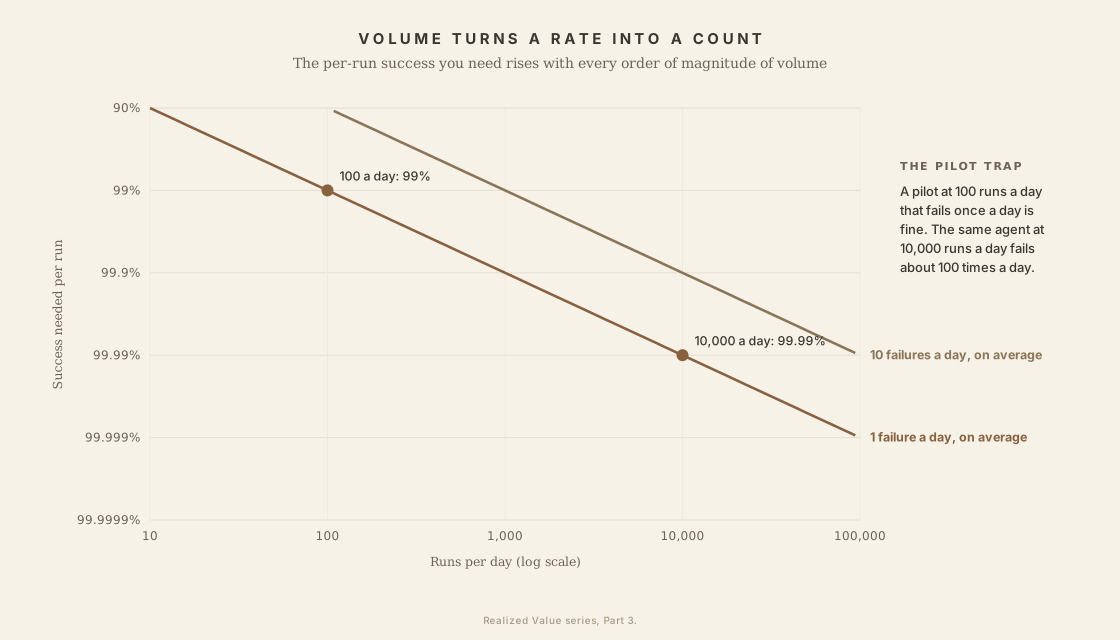
Volume turns a rate into a count. Customers and auditors see failures one at a time. To hold failures to one a day on average, an agent that runs 100 times a day needs 99% per run. At 10,000 runs a day it needs 99.99%. The same model, on the same task, can be fine in a pilot and unacceptable at scale.
Consequence sets the bar, detection discounts it. An irreversible action that nobody checks needs the highest bar. The same action behind a code check that catches the failure first needs a lower one, because the check turns silent failures into hand-backs. A check that only sometimes catches it discounts nothing for the cases it misses.
Re-estimate on every change. Exposure moves with each model, tool or prompt change, and with the data. And temperature 0 still leaves room for variation. Thinking Machines ran the same prompt 1,000 times at temperature 0 on one open model and got 80 different completions. The cause was server load changing the batch size the request ran in (He, 2025). A single run is one sample from a distribution.
A bar per action
One agent spans several tiers, as Part 4 found for safety. A support agent that searches the knowledge base and issues refunds needs a different bar for each. Here is how I would set reliability bars against Part 4's tiers. It is my proposal; I know of no industry standard.
| Tier (Part 4) | Example actions | Reliability bar | How to show it |
|---|---|---|---|
| Low | Search, summarise for a person who reads it | pass3 on the golden set | Golden set run three times on each change; sampled review in production |
| Medium | Reversible writes: draft a reply, open a ticket | pass4 on the golden set plus paraphrases; hand-back rate tracked | Repeated runs with paraphrased inputs; per-item results kept |
| High | A refund under a cap, a message to a customer | pass8 on your own traces with injected faults, or a code verifier on every run; silent-failure rate near zero | Confidence interval reported; verifier miss rate measured; ledger reconciled |
| Critical | A payment, an order, a production change | A verifier or a person must catch a failure before it takes effect; passk alone is insufficient | Verifier and approval error rates measured; passk measured on the whole system, checks included |
What comes in and what goes out
Part 4 asked whether a modality makes a wrong action more likely. Reliability asks a different question: does the modality widen the gap between the best run and the worst? The evidence below is mostly about that gap. Where I found none, I say so.
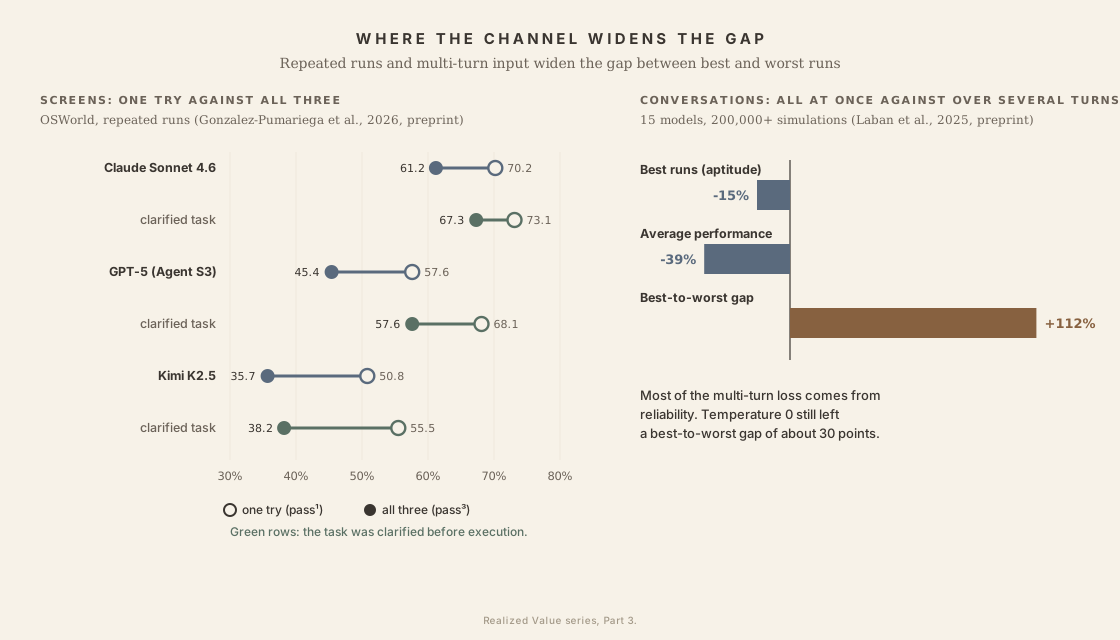
Long conversations. This is the strongest result I found. Laban and colleagues ran 15 models through more than 200,000 simulated conversations. When the same instruction arrived in pieces over several turns, performance fell 39% on average against giving it all at once. They split the fall into two parts. Aptitude, the score of the best runs, fell about 15%. Unreliability, the gap between the 90th and 10th percentile of ten runs, rose 112%. Setting temperature to 0 for both the assistant and the simulated user still left a gap of about 30 points. Their summary: "when LLMs take a wrong turn in a conversation, they get lost and do not recover" (Laban et al., 2025, preprint). Most of the cost of multi-turn work is reliability. A golden set of single-turn questions will not see it.
Voice in. τ-Voice ran the same customer-service tasks as text and as live voice calls. GPT-5 completed 85% in text. Voice agents completed 31% to 51% in clean audio, and 26% to 38% with background noise and varied accents. The accent effect depended on the provider: one lost 18 points on the retail tasks from accents alone, another lost 1 (Ray et al., 2026, preprint). Across languages, Spanish, Brazilian Portuguese and Hindi stayed within about 3 points of English, while Korean fell 14.7 points and Mandarin 8.4 (Ray et al., 2026b, preprint). Neither paper reports passk. Voice also adds a second source of variance before the agent sees anything. In the Careless Whisper study, Whisper's invented phrases "were produced non-deterministically": the same file, transcribed twice, could yield different invented text. About 1% of 13,140 clips contained one, more often for speakers with aphasia (Koenecke et al., 2024). When my team tested speech-to-summary and action-item agents, the failures followed one chain: poor audio and accent variability caused transcription errors, which led to misclassified intent and the wrong outcome (Part 4). Part 4's VoiceAgentBench result shows the usual shape of the slip: the right tool, the wrong parameters (91% against 41%) (VoiceAgentBench, 2026).
Screens. A study of computer-use agents on OSWorld ran each task several times. Claude Sonnet 4.6 solved 70.2% on one try and 61.2% on all three. GPT-5 in the Agent S3 framework went from 57.6% to 45.4%, and Kimi K2.5 from 50.8% to 35.7%. Cosmetic changes to the screen made Claude significantly less consistent. The largest gain came from clarifying the task before execution: GPT-5's pass3 rose from 45.4% to 57.6%. Deterministic decoding helped two models and hurt one (Gonzalez-Pumariega et al., 2026, preprint). That is R6 measured on screens: an agent that resolves ambiguity first is a more consistent agent.
Documents and images. The same content presented as text or as an image of that text can get different answers. A study of 15 multimodal models found the inconsistency persists even when the model reads the text correctly, and that text colour and resolution change the result while font does not (van Sprang et al., 2026, CVPR 2026). For document extraction, I found no published study of run-to-run variance. One September 2026 benchmark evaluated commercial APIs in a single pass. It also gives a useful warning: one fine-tuned model, shown documents unlike its training set, returned the same date for all 400 of them (Patel et al., 2026, preprint). That is consistent and always wrong. Consistency and correctness are separate properties, which is why the always, sometimes and never split needs a golden answer.
Structured output. Typed fields are what make passk checkable by code: compare the fields across runs. Constrained decoding now makes parse failures rare (0% for the commercial systems in the document benchmark above). But format can change the answer. In 2024 tests, strict JSON schemas cut accuracy on maths word problems and raised its spread across prompt variants: for Claude 3 Haiku the standard deviation went from 0.8 points in free text to 22.8 in JSON (Tam et al., 2024, preprint). Newer schema-based APIs closed most of that gap in the same paper's later runs. The practical rule: let the model reason in free text, then emit the fields.
Voice out. A spoken answer can't be re-read, so its slips go unnoticed. The evidence on text-to-speech errors with numbers, dates and codes is thin and vendor-run: one April 2026 benchmark of 31 kinds of non-standard text reported "significant failure rates" across leading providers without publishing independent figures (Async, 2026, vendor). One check you can run yourself: transcribe the agent's own speech and compare the names and numbers with the text it meant to say.
| Modality | Run-to-run evidence | Typical slip | Measure | What helps |
|---|---|---|---|---|
| Typed text, single turn | Thinking Machines: 80 different completions in 1,000 runs at temperature 0 | A different answer to the same question asked another way | passk across paraphrases of each golden item | Paraphrase variants; typed outputs compared field by field |
| Long conversations | Laban et al.: best-to-worst gap +112% when instructions arrive over several turns | An early wrong assumption the agent never recovers from | Spread across 10 runs of the same multi-turn script, with mid-conversation corrections | Restate the full request at checkpoints; test long sessions as well as single turns |
| Voice and call audio | Whisper's invented text varies between runs; no voice-agent passk published | Right tool, wrong name, number or date | Entity and number accuracy per accent group, language and channel, including 8 kHz audio | Pass recogniser confidence on; read back key details; keep the audio |
| Screens | OSWorld: pass1 70.2% to pass3 61.2% for Claude Sonnet 4.6 | The wrong element, or a changed layout | passk with cosmetic changes to the screen | Clarify the task first (R6); state checks and undo (R7) |
| Documents and images | Cross-modal inconsistency in 15 models; no repeated-run extraction study found | A misread field acted on | Field-level agreement across repeated extractions, against a golden answer | Extract twice and compare; show the source crop |
| Structured output | Strict JSON raised spread on reasoning tasks in 2024 tests | Valid format, different content | Field-by-field agreement across runs | Reason in free text, then emit the fields |
| Spoken output | Vendor-run only | A number or code read out wrongly | Transcribe the agent's speech and compare entities | Spell out codes; offer a text copy |
Rows built on preprints or vendor-run evidence are marked in the text. The "what helps" column for documents and spoken output reflects practice; I found no measured results for it.
Two things follow. First, an average over channels hides the worst one. Report passk per channel and per user group, for the same reason Part 4 rates severity per stakeholder. Second, the gaps are themselves a finding. Voice agents are going into contact centres now, and I found no published passk for any of them. If you run one, expect to measure it yourself.
Sector by sector
Part 4 maps the frameworks your risk team uses. Two speak to reliability directly. The EU AI Act asks high-risk systems to "perform consistently" in accuracy and robustness "throughout their lifecycle", and to be "as resilient as possible regarding errors, faults or inconsistencies" (Article 15). NIST's AI RMF lists "valid and reliable" as a trustworthiness characteristic (NIST AI 100-1). Singapore's October 2026 starter kit is titled for testing agentic systems "for Safety and Reliability" (IMDA, 2026). How the bar lands, by sector:
- Financial services. Volume is the driver. A refund agent at scale needs a silent-failure rate near zero, and the ledger is the verifier. Reconcile every confirmation against it.
- Healthcare. The summariser's slips are omissions, and omissions vary from run to run. Run the same chart several times and compare what each summary leaves out. A summary that is right on four runs and drops a contraindication on the fifth has a pass5 of zero on that chart, and nothing tells you which run missed it.
- Software. Tests are the verifier, so the coding agent's bar is lower per run. Flaky tests break that: they turn the verifier itself into a source of variance.
- Internal tools. The meeting summariser is Low. A person reads every output. pass3 on a small golden set, re-run on each model change, is enough.
Measuring reliability
Few public benchmarks report pass@1 and passk together. The ones that do tell the same story.
| Benchmark | Ceiling (solved once) | Floor (solved every time) | Source, evidence type |
|---|---|---|---|
| APEX-Agents v1 (Jan 2026) | 24.0% pass@1; 40.0% pass@8 | 13.4% pass8 | Mercor paper; vendor-built, public dataset |
| APEX-Agents 1.1 (Sep 2026) | 68.6% pass@1 (Fable 5.1) | 56.3% pass4 (GPT-6 Astra) | Mercor blog; vendor |
| τ-bench retail (Jun 2024) | about 61% pass1 (GPT-4o) | under 25% pass8 | Sierra paper; preprint |
Two notes on the table. APEX-Agents moved from pass8 to pass4 between versions, so 13.4% and 56.3% cannot be compared directly. And OSWorld 2.0 sits outside it, because its two numbers, full completion and partial credit, measure how much of a workflow gets done; on its revised task set, Claude Opus 5 leads with 44.3% full completion (Snorkel, 2026a). The question the introduction left open, whether consistency rose with single-try scores, has a partial answer: it rose, by less than the ceiling, and Mercor reports more headroom between pass@4 and pass4 than on the first version.
Reliability over time. The Princeton HAL dashboard is the only independent tracker of reliability across model generations. It now includes GPT-5.5, Gemini 3.1 Pro, Gemini 3.5 Flash and Claude Opus 4.7, and none of them scores meaningfully higher on overall reliability than Claude Opus 4.5 at 0.85 (HAL, 2026). Opus 4.7 gained about five points of accuracy over Opus 4.5 and lost calibration (0.97 to 0.76). GPT-5.5 reached 62.8% accuracy with an outcome consistency of 0.60. The dashboard does not yet include Claude Opus 4.8, Opus 5, Fable 5, GPT-5.6, GPT-6 Astra or Gemini 4 Argon.
Golden datasets: run them k times
Public benchmarks rank models. Your golden dataset is what tells you about your own system, and most teams already have one. What I see most often is a set of a few hundred known questions with known answers, run once before each release, reported as a single accuracy figure. That is a capability measurement: it says what the system can do once.
The best practical guide to building that set is Hamel Husain and Shreya Shankar's evals FAQ. It starts with error analysis, which it calls "the most important activity in evals": read real traces, name the failure modes, and only then write evals for the ones that matter. It builds the eval set from "important workflows and confirmed failures", keeps CI sets "small (in many cases 100+ examples) and purpose-built", and prefers "assertions or other deterministic checks over LLM-as-judge evaluators" (Husain and Shankar, 2026; CI/CD FAQ). I agree with all of it. For combining checks, they recommend a "pass all" rate: "An example passes only if it passes every check." Passk applies the same rule across runs: an example passes only if it passes every run. What the FAQ does not cover, as far as I can find, is running the same input more than once. That is the step this part adds.
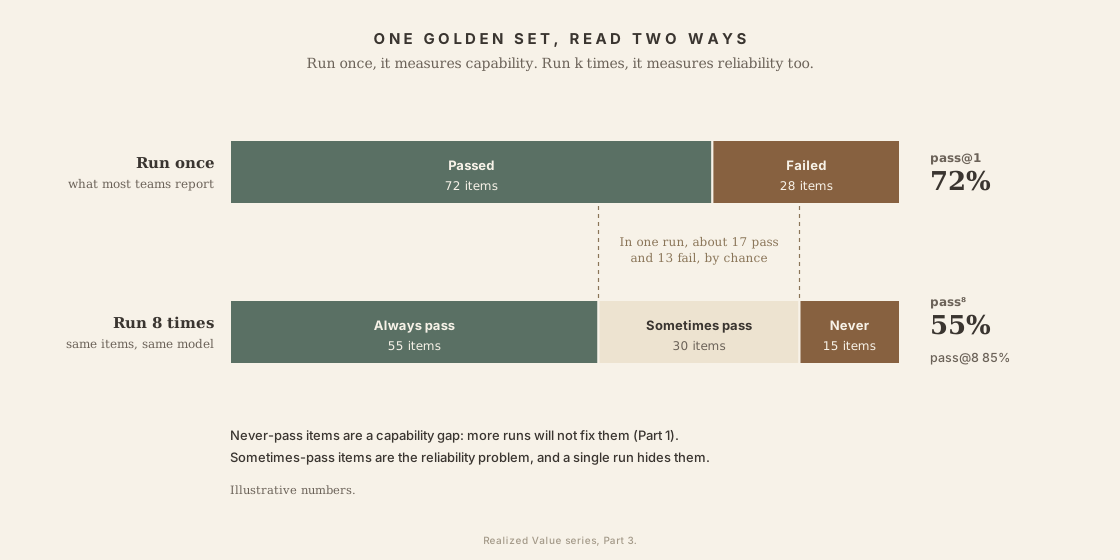
Run the same set k times and sort every item into one of three groups:
- Always passes. Reliable on this item.
- Never passes. A capability gap. More runs won't fix it; go back to Part 1.
- Sometimes passes. The flaky middle. This is the reliability problem, and pass@1 hides it, because a single run puts each flaky item in one bucket or the other by chance.
IMDA's starter kit for testing agentic systems makes the same point in plainer words. In its case study, each test case was run three to five times with the same model and configuration, and "a single successful run was not treated as evidence that the agent is reliable". It adds that for high-recall tasks "the worst-performing run may be more important than average performance" (IMDA, 2026).
Four changes turn a golden set into a reliability test, without new labels:
- Run every item k times. Three is the floor, eight is better for High-tier actions. Keep the per-item results as well as the average.
- Add paraphrases. A golden set with one fixed phrasing per question tests the phrasing. Three or four rewordings per item test the question. Husain and Shankar's method for synthetic inputs helps here: define dimensions of the query (who asks, about what, in which scenario), generate combinations, then turn them into queries. They add a caution that applies to reliability too: "Synthetic data cannot tell you how common a failure is in production."
- Add faults and long sessions. A timeout, a stale token, a changed schema, a correction in turn twelve. The golden answer stays the same; the conditions change.
- Feed it from production. Every incident becomes a new item. IMDA calls this a regression set: "a collection of test cases used to verify that system behaviour stays stable over time". Husain and Shankar give the same loop: when production monitoring finds a new failure pattern, "add representative examples to your CI dataset".
One point needs care. The FAQ warns that "If you're passing 100% of your evals, you're likely not challenging your system enough", and suggests retiring evals that keep passing. That is right for capability. For reliability, an eval that passes every item once may still fail some of them at k = 8. Before you retire a saturated eval, run it k times. If the flaky middle is empty, retire it. If not, it is now a reliability test.
Golden sets have one more advantage. The known answer means the grader can often be code: exact match, a field comparison, a database state. That removes most of the grader problem below.
How many tasks, how many runs
Passk is a statistic, and most published versions of it come without error bars. Three things matter.
Sample size. With 100 tasks and a measured passk of 56%, the 95% confidence interval is about ±10 points. With 30 tasks it is about ±18. Two models 10 points apart on a 100-task set may not differ at all. Mercor's APEX-Agents 1.1 post reports no intervals; by the same arithmetic, a score near 56% on its 240 tasks carries about ±6 points. Report yours. Husain and Shankar give the production version of the rule: track confidence intervals on production metrics, and "If the lower bound crosses your threshold, investigate further."
The estimator. Run each task n times, with n at least k, and count c passes. The share of k-run subsets that all pass is C(c,k) / C(n,k). Average it across tasks. This is the estimator τ-bench uses (Yao et al., 2024). Running more than k times gives a steadier estimate than running k times.
Grader errors compound with k. Husain and Shankar measure a judge by two rates against expert labels: the true positive rate (when the expert says pass, how often the judge also says pass) and the true negative rate (when the expert says fail, how often the judge also says fail) (Husain, validate-evaluator). Suppose the true positive rate is 95%, so the grader wrongly fails 5% of correct runs. On one run, that costs five points. On eight runs, an agent that is right every time scores 0.958, about 66% pass8. A third of the score went to grader error. Errors the other way inflate pass@1: a grader with a low true negative rate sometimes passes a wrong answer, which makes never-pass items look flaky. This is why a code check on a golden answer is worth more for reliability than for capability.
Measuring costs money. Two hundred tasks at k = 8 is 1,600 runs. At $2 a run, that is $3,200 for one full pass, before paraphrases, and you re-run it on every change. Budget for it per run, the way Part 2 budgets inference.
The grader problem
A reliability number is only as reliable as the thing that grades it. Three findings from 2026:
- LLM judges inflate newer models. CAIS calibrated an automated judge on older systems for the Remote Labor Index, then applied it unchanged. It rated GPT-5.5 at 17.9% against a human-graded 6.25% (about 2.9×), and Opus 4.8 at 18.8% against 8.33% (about 2.3×). It still ranked the models correctly (CAIS, 2026). Their explanation: grading a deliverable is itself an agentic task, so the judge inherits the worker's limits.
- Experts disagree too. OpenAI's GDPval grader agreed with human experts 66% of the time. Experts agreed with each other 71% of the time (Patwardhan et al., 2025).
- Models game rubrics. Mercor found models hedging with several answers to collect rubric credit. Penalising this cost some older models more than 20% of their pass@1 (Mercor, 2026b).
Benchmarks have bugs too. OSWorld 2.0 issued a bug-fix release in September 2026 that changed task snapshots and evaluation workflows (OSWorld-V2 release notes). Deterministic grading helps: τ-bench checks the final database state, and Agents' Last Exam scores tasks with deterministic graders against hidden references (Snorkel, 2026b). Where a code check is possible, use it.
Where it isn't, build the judge the way Husain recommends. One trusted domain expert gives a pass or fail on each output, with a written critique of why. Those critiques become the judge's examples, and the judge is revised until it agrees with the expert (Husain, 2024). His guide to validating a judge says to "Aim for ~50 Pass and ~50 Fail" labelled examples, split into training, development and test sets so the judge isn't tuned to the test (Husain, validate-evaluator). Binary verdicts matter more for reliability than for capability: a 1-to-5 score that drifts by a point between runs makes an inconsistent judge look like an inconsistent agent.
Reliability benchmarks you can run
The table at the top of this section lists published results. These benchmarks are public, so a team can run them on its own configuration, k times. Check the grading column first, for the reason above.
| Benchmark | What it tests | Graded by | Reliability reading | Evidence type |
|---|---|---|---|---|
| τ-bench, τ²-bench, τ³-Banking | Agents serving simulated users under a written policy | Final database state | passk built in | Preprint; leaderboard self-reported |
| APEX-Agents | Banking, consulting and legal work across 33 environments | Rubrics, LLM judge | pass@k and passk; public dataset | Vendor-built |
| OSWorld 2.0 | 108 long workflows across desktop applications | Checkpoints in the environment | Full completion and partial credit; run it k times yourself | Independent; preprint |
| Agents' Last Exam | Long professional workflows across 55 fields | Deterministic graders against hidden references | Full pass and partial; repeat runs for passk | Preprint |
| HAL reliability (GAIA, τ-bench airline) | Twelve reliability metrics with paraphrase and injected faults | Harness metrics; five runs per task | Consistency, robustness, predictability; harness is public | Peer-reviewed (ICML 2026) |
Two cautions. Benchmark scores move with the benchmark version, as OSWorld 2.0 showed, so record which release you ran. And a public benchmark tells you whether a model is worth testing. Your golden set tells you whether it is reliable enough to deploy. Husain and Shankar are blunter about generic metrics: they "waste time and create false confidence when you use them as quality measures".
Testing tools
- Inspect, from the UK AI Security Institute, runs each sample several times ("epochs") and has a built-in reducer,
pass_k_{k}, for "the probability that all k epoch attempts succeed", alongsidepass_at_{k}for pass@k (Inspect docs). A golden set loaded into Inspect gives passk with one setting. - τ-bench's own harness runs repeated trials and reports passk against the database state.
- HAL's harness (princeton-pli/hal-harness) computes the Princeton reliability metrics, including fault injection and paraphrase.
Commercial and in-house harnesses, including the one my team builds for Sunshine.guardian, follow the same pattern: a scenario, a simulated user, repeated runs, a grader. Ask any of them for per-item results across runs. A single aggregate hides the flaky middle.
The enterprise version: your own traces
Public benchmarks tell you about their tasks. To get passk for yours, you need three things:
- A golden set drawn from your production traces, with the outcome checked against ground truth where possible.
- Each item run k times, with paraphrased instructions, injected faults (timeouts, stale tokens, a changed schema) and long sessions.
- A grader you have checked against human judgement on a sample, re-checked whenever the model changes.
Anthropic's eval guidance names this pattern: capability evals that "graduate" into regression suites held near 100% (Anthropic, 2026a). It also found infrastructure resource limits alone moved coding-eval success by six points (Anthropic, 2026b). So a harness or infrastructure change needs the regression suite as much as a model upgrade does.
What this looked like in practice. In IMDA's Global AI Assurance Sandbox, my team at NCS tested a career guidance chatbot we built for a client (Part 4 describes the engagement). Consistency was one of the risks we tested. We used conversations of 10 to 25 turns with paraphrases and mid-conversation corrections. Across nine scenarios we ran 45 simulated conversations and aggregated the scores across runs to see how consistent the system was. The scoring was strict: if one criterion failed, the response failed. The review found that the system gave consistent recommendations (AI Verify Foundation, 2026).
Metrics to ask for
Ask for these from any team, vendor or harness, measured on your own golden set and traffic. Part 4 has the matching table for guardrails and judges.
| Metric | What it tells you |
|---|---|
| passk at a stated k, with a confidence interval | How often the system gets it right every time |
| Per-item split: always, sometimes, never | Which failures are reliability (flaky) and which are capability (never) |
| Hand-back rate and silent-failure rate, per run | Whether failures arrive labelled or land unseen |
| Worst run, beside the average | The run IMDA's case study weighs most for high-recall tasks |
| passk per channel and user group | Whether one channel or group carries the failures |
| Per-step tool error and retry rates | Where the compounding starts |
| Recovery rate after an injected fault | Whether the agent resumes or starts over (R7 to R9) |
| Calibration of the confidence used to hand back | Whether hand-backs fire on the right runs (R10) |
| Verifier false-accept and false-reject rates | Silent failures let through, and retries wasted (R4, R5) |
| Judge true positive and true negative rates against an expert's labels | Whether grader error is moving passk |
| Change after a model, harness, tool or infrastructure upgrade | Whether reliability moved when accuracy didn't (R12) |
The reliability levers
I group the levers by the question each answers, as Part 2 did with the 5 Cs. Here there are five groups and twelve levers, numbered R1 to R12. The evidence is thinner than for cost. Where no measured agent result exists, I say so and fall back on standard practice from distributed systems.
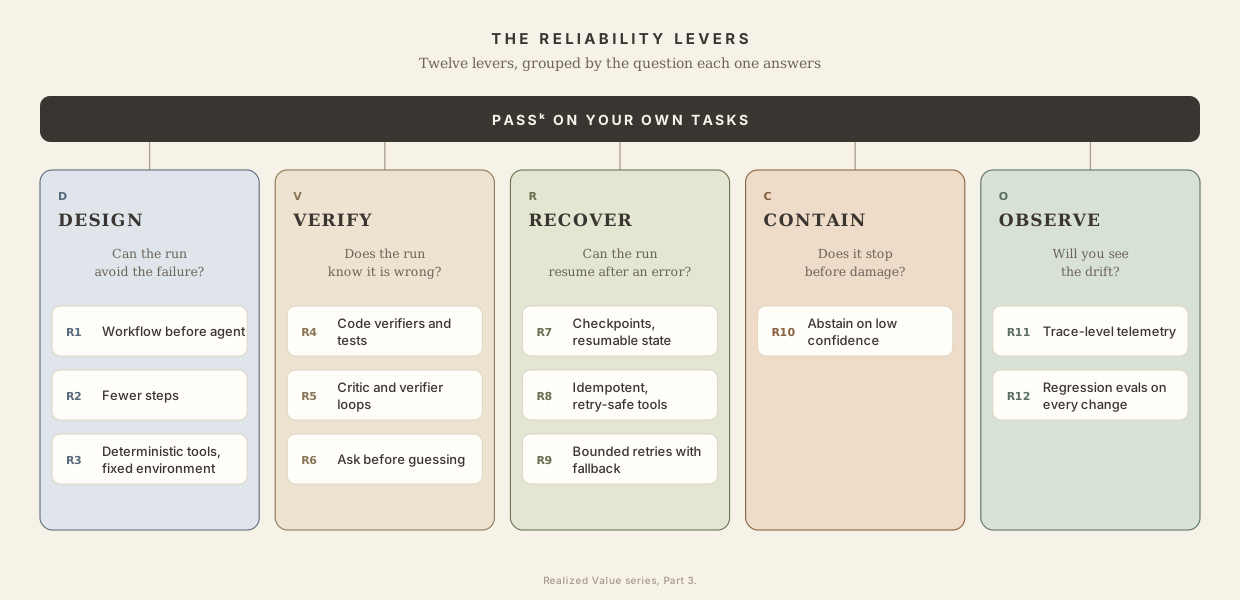
D. Design out variance: can the run avoid the failure at all?
R1. Workflow before agent. The cheapest reliability is the variance you never create. Anthropic's guidance is that workflows give predictability and consistency for well-defined tasks, and that many applications need only a well-built single call (Anthropic, 2024). This is Lever 3 in Part 2, and it pays twice.
R2. Fewer steps. From the compounding math, every step removed multiplies task success by 1/p. Batch tool calls, merge redundant lookups, shorten the plan.
R3. Deterministic tools and a fixed environment. Structured outputs, typed tool schemas, pinned dependencies. Mercor's 1.1 fix list pre-installed every dependency that appeared 25 or more times across 26,302 trajectories, removing a whole class of run-to-run variance (Mercor, 2026b).
V. Verify: does the run know when it is wrong?
R4. Code verifiers and tests. Where the outcome can be checked by code (a test suite, a database state, a reconciled total), check it on every run. This is what makes τ-bench and Agents' Last Exam trustworthy.
R5. Critic or verifier loops. CAIS added a worker-critic loop on the Remote Labor Index because workers are too optimistic about their own output, and reports it improves results without publishing an ablation (CAIS, 2026). One preprint ablation found a verifier loop raised cost per success from $5.43 to $7.58 (arXiv 2605.15237). Verification buys reliability, and you pay for it.
A verifier is a classifier, so it has the two error rates Part 4 measures for guardrails. A false accept lets a wrong result through as a success: a silent failure. A false reject sends a correct result back for a retry or a hand-back it didn't need, which costs money and attention. Measure both on the golden set, by running the verifier over outputs you already know are right and outputs you know are wrong. A verifier from the same model family as the agent is likely to share its blind spots, so prefer a code check, and mix families where you can't.
R6. Ask before guessing. On APEX-Agents 1.1 (model names as Mercor gives them), Gemini 3.8 Flash searched communications for clarifying information on 93.1% of runs. Kimi K3 and GPT-5.6 Sol did so on about 15%. When Kimi K3 did search, its task-level pass@1 rose 29.7% (Mercor, 2026b). Inconsistent information-seeking is a measurable cause of inconsistent outcomes. R6 is about looking for information that already exists. Asking a person, and checking that the answer is real consent, is S4 in Part 4.
R. Recover: can the run resume after an error?
R7. Checkpoints and resumable state. Save state after each completed step so a failure restarts from the last good point.
R8. Idempotent, retry-safe tools. A retried call must not charge a card twice or file a ticket twice. Idempotency keys on every write.
R9. Bounded retries with fallback. OpenAI's guidance is to cap retries and actions, and escalate to a human when the cap is hit (OpenAI, 2025). Every escalation is a hand-back that lands on a person, so count it against the hand-back budget.
I found no published agent study with numbers for R7 and R8. They are standard practice in distributed systems, and I present them that way.
C. Contain: does the run stop before it does damage?
R10. Abstain on low confidence. Predictability is what makes this lever work. An agent whose confidence tracks its accuracy can be gated: high confidence proceeds, low confidence escalates. HAL's calibration scores show this varies by model and can get worse on an upgrade (Opus 4.7). The gate design belongs to Part 5. The calibration that triggers it belongs here. Part 4 covers the same lever from the safety side, as S5.
O. Observe: will you see the drift?
R11. Trace-level telemetry. OpenTelemetry's GenAI conventions now define agent and tool spans (invoke_agent, execute_tool), though they remain at Development stability (OpenTelemetry, 2026). Trace every run, so passk can be computed from production runs.
R12. Regression evals on every change. Model upgrade, harness change, tool change, infrastructure change. Re-run the golden set k times on each, and compare the per-item split as well as the average. Part 4's S11 is the behavioural twin of this lever.
| Lever | Group | Best evidence | Evidence type |
|---|---|---|---|
| R1 Workflow before agent | D | Anthropic, Building effective agents | Provider primary |
| R2 Fewer steps | D | Compounding arithmetic | Analytical |
| R3 Deterministic tools, fixed environment | D | Mercor 1.1 dependency fix | Vendor |
| R4 Code verifiers and tests | V | τ-bench, Agents' Last Exam grading | Preprint |
| R5 Critic and verifier loops | V | CAIS RLI; arXiv 2605.15237 | Independent (no ablation); preprint |
| R6 Ask before guessing | V | APEX-Agents 1.1 analysis | Vendor |
| R7 Checkpoints, resumable state | R | Distributed-systems practice | No agent study found |
| R8 Idempotent tools | R | Distributed-systems practice | No agent study found |
| R9 Bounded retries, fallback | R | OpenAI, practical guide to agents | Provider primary |
| R10 Abstain on low confidence | C | HAL calibration metrics | Peer-reviewed |
| R11 Trace telemetry | O | OpenTelemetry GenAI conventions | Standard (Development) |
| R12 Regression evals | O | Anthropic, Demystifying evals; infrastructure noise; IMDA regression sets | Provider primary; government |
Reliability costs money
The factors trade off, and reliability against cost is the clearest case. Retries, best-of-n, verifier loops and higher effort all raise the cost of a run. Whether they lower the cost per successful task depends on one thing: can the system tell a right answer from a wrong one?
If it can, retries convert pass@k into delivered success, and cost per success can fall. If it can't, retries do nothing for passk. You pay more and ship the same wrong answer with the same confidence.
- Effort buys success, up to a point. On OSWorld 2.0's revised task set, Opus 5's partial-credit score rises from 59.1% at low effort to 77.7% at max, in one aggregator's copy of the board (DataLearner). Anthropic's Opus 5 launch charts put max effort slightly below xhigh on Frontier-Bench, at about 15% more cost (values read off the chart by Moraru, 2026).
- Budget caps cut success. A $1 per-task cap cut Claude Code success from 70.6% to 44.2% on TestEvo-Bench (arXiv 2607.02469).
- Verification has a price. In one ablation, a verifier loop raised mean cost per trial from $2.65 to $7.33, and cost per success from $5.43 to $7.58 (arXiv 2605.15237).
Part 2 already set the unit: cost per successful task, with retries and failures counted in. Reliability adds one refinement. Count a task as successful only if it was verified. Mean cost divided by verified pass rate. Confidence-gated work (Lever 4 in Part 2) is where the two parts meet: pay for the extra check only when a cheap signal says you need it.
The weights question
Part 1 set out five attributes of a use case that move the factor weights: stakes, autonomy, reversibility, integration complexity and verifiability. Stakes and reversibility set how high the reliability bar must be (the Consequence family above). The other three set how much weight reliability carries against the other factors.
- Autonomy raises reliability's weight fastest. With a human checking each output, one bad run costs a minute of review. With no checkpoint for an hour, per-step failures compound unseen.
- Integration complexity adds steps and failure surfaces, as above.
- Verifiability works the other way. Where outputs can be checked by code, a verifier lever (R4) catches failures before they ship, and the weight falls.
Applied to the same five use cases from Part 1, with the reliability bar each one needs:
| Use case | Autonomy | Integration | Verifiability | Reliability bar | Reliability's place |
|---|---|---|---|---|---|
| Internal meeting summariser | Low | Low | Medium | pass@1 is fine; a human reads every output | Minor |
| Patient-chart summariser | Low | Medium | Low | High consistency; a missed item is an incident | Second, after safety |
| Trading agent | Variable | High | High | passk near 100% on irreversible steps | Second, after controllability |
| Customer-support agent (refunds) | High | High | High | passk at customer volume | First |
| Coding agent (open PR, run tests) | High | High | High | Tests catch most failures; passk matters less per run | Second, after capability |
These are use-case weights. Within a use case, set the bar per action, as in A bar per action above.
The customer-support case is where reliability binds first. Every conversation is a fresh try. A 90% pass@1 agent fails one customer in ten, and the customers who get the failure don't see the average.
Traps
Nine common ways to mis-read reliability.
| Trap | The mistake | Why it fails |
|---|---|---|
| The Golden-Set Trap | Run the golden dataset once before each release | One run puts each flaky item in pass or fail by chance; the next run can give a different score with nothing changed |
| The Pass@1 Trap | Write an SLA around a single-try score | Carried over from Part 1; passk is what customers get |
| The Best-Run Trap | Judge the agent on a demo | A demo is pass@k: the best of several runs, picked after the fact |
| The Averaging Trap | Report mean success | The mean hides which tasks fail every time and which fail at random |
| The Small-Sample Trap | Compare passk on a few dozen tasks | At 30 tasks the interval is about ±18 points; most differences vanish inside it |
| The Grader Trap | Trust an LLM judge on a new model | Judges calibrated on older models overstated newer ones by 2.3 to 2.9 times (CAIS) |
| The Retry-Hides-It Trap | Let retries absorb flakiness | Retries mask a falling passk until volume or cost exposes it |
| The Version Trap | Compare scores across benchmark releases | Opus 5 gained about 13 points on OSWorld 2.0 from the revised task set alone |
| The Upgrade Regression Trap | Swap the model, keep the harness, skip the evals | Accuracy can rise while calibration falls (Opus 4.5 to 4.7: 0.97 to 0.76) |
The first three are the most common. All three mistake a ceiling for a floor. The fix is the same as in Part 1: report capability and reliability as two numbers, and never let one stand in for the other.
Order of operations
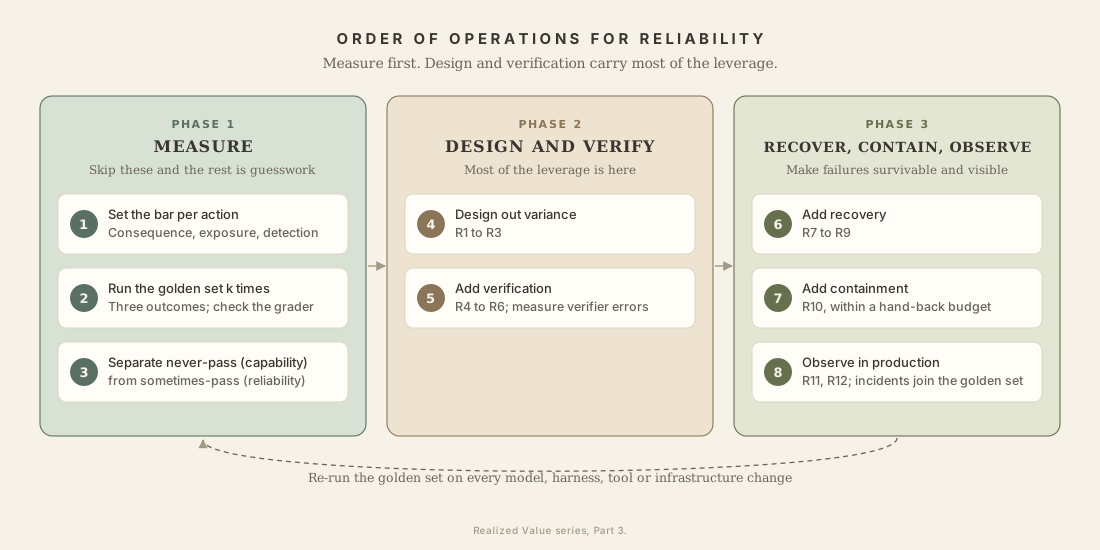
This is the sequence I recommend for raising reliability with the least wasted effort.
- Set the bar per action. List the actions, rate consequence, exposure and detection, and write down the k and silent-failure rate each tier needs.
- Run the golden set k times. Add paraphrases, faults and long sessions. Count three outcomes. Check the grader against humans, and use code where the answer is known.
- Separate the failures. Items that never pass are capability problems: go back to Part 1. Items that pass some of the time are reliability problems: continue here.
- Design out variance (R1 to R3). Workflow before agent, fewer steps, fixed environment.
- Add verification (R4 to R6). Code checks first, critics where code can't reach, and information-seeking under ambiguity. Measure the verifier's two error rates.
- Add recovery (R7 to R9). Checkpoints, idempotent tools, bounded retries.
- Add containment (R10). Hand back on low confidence, within a hand-back budget, and hand the checkpoint design to Controllability.
- Observe (R11, R12). Trace production, compute passk from real runs, feed incidents into the golden set, and re-run it on every change.
Steps 1 to 3 are measurement. Skip them and the rest is guesswork. Most of the leverage is in steps 4 and 5.
Scope: what this deep dive leaves to the others
This part covers how to measure reliability and how to raise it. Three questions sit next to it.
Contract-ready specifications. Part 1 promised a way to write "can do X" into a contract. This part supplies the measurement clause: passk at a stated k, with its confidence interval, beside the hand-back and silent-failure rates, on a stated task set, with a stated grader. Part 4 adds the behaviour clause. The bounds clause (what the agent may do when it is wrong) is Controllability's, in Part 5. I found no enterprise publishing agent SLOs or passk terms yet, so this is a recommendation. One preprint proposes an agent error budget, B = (1 − SLO) × number of decisions, with autonomy that widens or narrows as the budget is used (arXiv 2608.10153). It has not been tested in deployment.
Behaviour under ambiguity. Whether the agent invents an action, hedges or asks is Safety, in Part 4. Princeton's safety dimension is reported there.
Harness portability on upgrades. This part covers the regression eval. Pruning the harness on each upgrade stays in Part 5.
What would change the argument
Four published results would move it:
- HAL reliability scores for the models it has not yet evaluated (Opus 4.8 onward, GPT-5.6, GPT-6 Astra, Gemini 4 Argon). If they show a clear step up in consistency and calibration, Claim 1 weakens.
- A narrower gap between pass@4 and pass4 on the next APEX-Agents release. That would mean the floor is catching the ceiling.
- A named production study of checkpointing or idempotency for agents, with numbers. That would turn R7 and R8 from practice into evidence.
- Published passk or consistency figures in lab system cards. The September and October 2026 cards report agentic safety in detail, but I found no repeated-run reliability figures in them. If labs start publishing passk next to pass@1, Claim 3's "measure it yourself" becomes "check it yourself".
What this means for enterprise programmes
The ceiling is rising fast. The floor is rising slowly. On the best evidence available in November 2026, the gap between solved-once and solved-every-time stays open, and on APEX-Agents 1.1 Mercor reports more headroom between pass@4 and pass4 than on the first version.
For a programme, that means five things:
- Run your golden dataset k times. You already have the data. Keep the per-item split, and add paraphrases and faults.
- Write SLAs on passk. Name k, the task set and the grader, and report the hand-back and silent-failure rates beside it.
- Set the bar per action, and budget for it. Volume, consequence and detection decide k. Measuring at that k costs real money; plan it at design time.
- Spend reliability effort on design and verification first. Fewer steps and code checks do more than a bigger model.
- Re-measure on every change. A model, harness or infrastructure change can move reliability without moving accuracy.
Reliability is the discount most likely to bind once autonomy rises. Part 4 takes up the next one: what the agent does when it is uncertain.
Capability sets the ceiling. Reliability decides how often you reach it.
- 0Introduction ↗The framework. How the factors multiply.Published
- 1Capability ↗The model sets the ceiling. The system decides how much of it you get.Published
- 2Cost ↗Cost per successful task.Published
- 3Reliabilitypass@always, and why it lags capability.This article
- 4Safety ↗The agent's behaviour under uncertainty.Published
- 5Controllability ↗The operator's leverage, and where security fits.Published
Figures were retrieved and checked between October 31 and November 1, 2026. Several move quickly, notably the APEX-Agents and OSWorld 2.0 leaderboards. Vendor-reported figures (Mercor, OpenAI, Anthropic, Sierra) and preprints are labelled as such in the text. The HAL dashboard does not yet include Claude Opus 4.8 or later models. The Monday and Tuesday golden-set scores, the golden-set example, the two-agent comparison, the 300-call workflow and the volume chart use illustrative numbers, and are labelled as such. Verify against the primary sources before relying on any single number.
References
- Rabanser, Kapoor, Kirgis, Liu, Utpala, Narayanan. Towards a Science of AI Agent Reliability (arXiv 2602.16666; ICML 2026, PMLR vol. 306). Peer-reviewed.
- Princeton HAL Reliability Dashboard, GAIA (accessed Oct 31 2026; 15 agents).
- Mercor. APEX-Agents (arXiv 2601.14242, Jan 2026) (2026a). Introducing APEX-Agents 1.1 (Sep 8 2026) (2026b). Leaderboard.
- Yao et al. τ-bench (arXiv 2406.12045, Jun 2024). Sierra, Benchmarking AI agents. τ-bench leaderboard.
- XLANG Lab. OSWorld 2.0 (arXiv 2606.29537, Jun 2026); v2.1 bug-fix release (Sep 16 2026). Snorkel AI. OSWorld 2.0 leaderboard (2026a). DataLearner. OSWorld 2.1 scores by effort. Aggregator.
- Berkeley RDI and Snorkel AI. Agents' Last Exam (arXiv 2606.05405, v4 Oct 25 2026). Snorkel AI. Agents' Last Exam leaderboard (2026b).
- METR. Task-completion time horizons (corrected Mar 3 2026; no longer updated since Sep 8 2026). Time horizon limitations (Jan 2026).
- IMDA. Starter Kit for Testing Agentic Systems for Safety and Reliability, v1.0 (Oct 2026). Government.
- He (Thinking Machines). Defeating Nondeterminism in LLM Inference (Sep 10 2025).
- UK AI Security Institute. Inspect: scoring metrics and epoch reducers (accessed Nov 1 2026).
- Princeton PLI. hal-harness.
- AI Verify Foundation. Global AI Assurance Sandbox case study: Career Guidance Chatbot, NCS (application tested) and AIQURIS (assurer) (2026). See also Part 4.
- Husain and Shankar. Frequently Asked Questions (And Answers) About AI Evals (updated Sep 2026). Practitioner guidance.
- Husain and Shankar. How are evaluations used differently in CI/CD vs. monitoring production?
- Husain and Shankar. How do I evaluate agentic workflows?
- Husain. validate-evaluator skill (evals-skills). Practitioner guidance.
- Husain. Creating a LLM-as-a-Judge That Drives Business Results (Oct 2024).
- Laban, Hayashi, Zhou, Neville. LLMs Get Lost In Multi-Turn Conversation (arXiv 2505.06120, May 2025). Preprint.
- Ray, Dhandhania, Barres, Narasimhan. τ-Voice: Benchmarking Full-Duplex Voice Agents on Real-World Domains (arXiv 2603.13686, Mar 2026). Preprint. τ-Multilingual (arXiv 2609.35820, Sep 2026). Preprint.
- Koenecke et al. Careless Whisper: Speech-to-Text Hallucination Harms (FAccT 2024).
- Gonzalez-Pumariega, Agashe, Yang, Li, Wang. On the Reliability of Computer Use Agents (arXiv 2604.17849, Apr 2026). Preprint.
- van Sprang et al. Same Content, Different Answers: Cross-Modal Inconsistency in MLLMs (arXiv 2512.08923; CVPR 2026).
- Patel et al. Beyond Accuracy: Robustness, Cost, and Governance Trade-offs for Vision-Language Models in Templated Document Extraction (arXiv 2609.15706, Sep 2026). Preprint.
- Tam et al. Let Me Speak Freely? A Study on the Impact of Format Restrictions on Performance of Large Language Models (arXiv 2408.02442, 2024). Preprint.
- Async. Open TTS pronunciation benchmark (Apr 2026). Vendor.
- CAIS. A Significant Increase in Digital Labor Automation (Jul 1 2026)
- Patwardhan et al. GDPval (arXiv 2510.04374, Oct 2025)
- Anthropic. Demystifying evals for AI agents (Jan 9 2026) (2026a). Infrastructure noise in agent evals (2026b).
- Anthropic. Building effective agents (Dec 2024)
- Classifying wrong actions: VoiceAgentBench (arXiv 2510.07978, v3 Feb 2026), preprint. The Register on the Replit database deletion (Jul 2025). OpenAI. GPT-6 Astra System Card (Sep 2026), vendor.
- OpenAI. A practical guide to building agents (Apr 2025)
- Moraru. Opus 5: xhigh vs max effort (2026), reading values off Anthropic's Opus 5 launch charts. Secondary.
- Anthropic. Claude Code auto mode (Mar 25 2026). Auto mode is now the default in Claude Code (Aug 7 2026). Vendor.
- Verifier-loop cost ablation (arXiv 2605.15237). TestEvo-Bench (arXiv 2607.02469). Agent error budgets, CASE (arXiv 2608.10153). Preprints.
- OpenTelemetry. GenAI agent spans. Semantic conventions v1.42.0 (Jun 2026).
- Narayanan and Kapoor. New paper: Towards a science of AI agent reliability (AI as Normal Technology, Feb 2026)