From framework to ROI
Five parts measured where value leaks between a model's capability and production. This part puts a price on each leak, works through a real deployment with reported numbers, and merges the five build orders into one. In the real case, the agent's fee is the smallest line, and the number that decides the case is the one the public record leaves out.
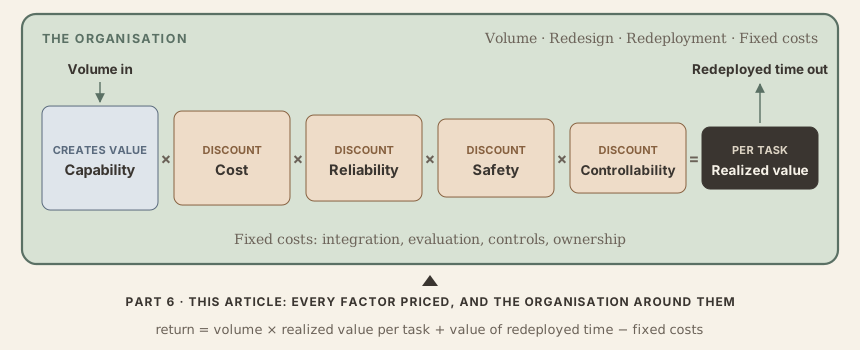
- Price the agent per case, against the human baseline. Each factor becomes a line: run cost, hand-backs, silent failures, unsafe actions, approvals.
- In customer service, the public record shows a real saving. With published prices and resolution rates, an agent saves $3.57 to $5.34 a conversation against an $8.01 live contact.
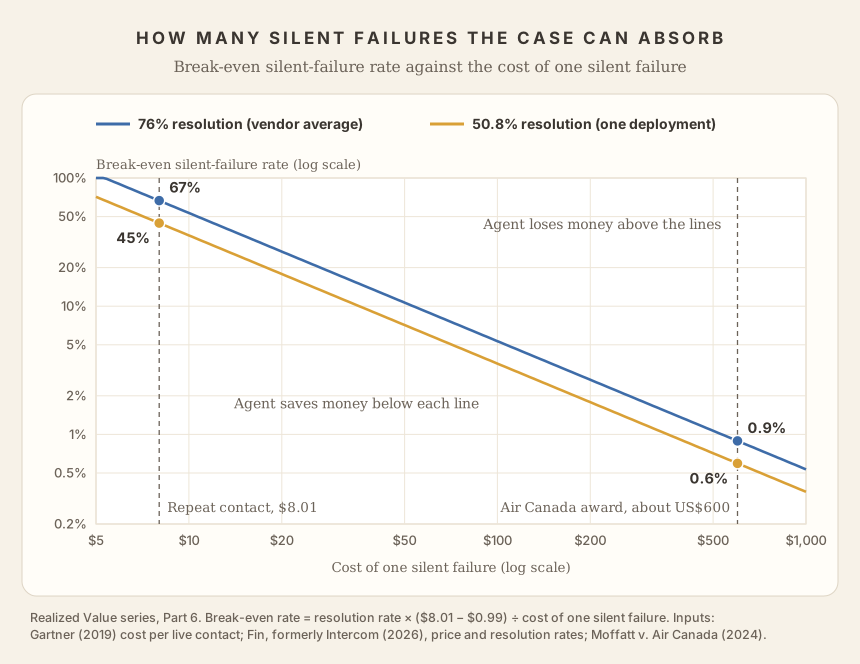
- The silent-failure rate decides the case, and the public record leaves it out. If 1% of conversations end like Air Canada's tribunal case, the saving is gone.
- The agent's fee is the smallest line. Ten points of resolution rate are worth about as much as the whole fee.
- The return depends on the organisation: the volume routed to the agent, the work redesigned around it, and what people do with the time freed, after fixed costs.
In October, Gartner published a survey of 2,002 CIOs. Only 13% said their enterprise had realised significant or transformational value from AI. Only 31% had guidelines for stopping pilots before production, and 17% had guidelines for abandoning low-value AI already in production. Organisations with those guidelines were 2.3 and 2.6 times more likely to be in Gartner's leading group (Gartner, 19 Oct 2026).
In June 2025, Gartner predicted that over 40% of agentic AI projects would be cancelled by the end of 2027. It gave three reasons: escalating costs, unclear business value and inadequate risk controls (Gartner, 25 Jun 2025).
Each reason maps onto a discount. Escalating costs is Part 2. Unclear value follows when there is no human baseline to compare against and no reliability number (Part 3). Inadequate risk controls is Part 4 and Part 5.
The series has given each factor a unit, a test, a set of levers and a contract clause. This part puts them on one sheet, in money. It answers two questions. How does an enterprise use the framework to get a return? And how does a team building an agent put it into practice?
Read the formula as a cost model
The formula is a mental model. Its shape is the point: the factors multiply, so the one nearest zero sets the outcome. A business case needs the same idea in money, per case handled. Each factor maps onto one line.
| Factor | Business-case line | Unit from the series |
|---|---|---|
| Capability | Which cases the agent can attempt at all. Cases beyond the ceiling stay with people | Measured under generous conditions (Part 1) |
| Cost | What each run costs | Cost per successful task (Part 2) |
| Reliability | Hand-backs cost a person's time. Silent failures cost rework, refunds and complaints | passk, with the hand-back and silent-failure rates (Part 3) |
| Safety | Expected loss from actions outside the agent's authority: rate times severity | Severity-weighted unsafe-action rate, at its intervention rate (Part 4) |
| Controllability | The cap on the worst case, and the approver time the gates use | Bounded share, bound-leak rate, time-to-halt, gate load (Part 5) |
For the cases inside the ceiling, that gives a cost per case to set against the human baseline:
agent cost per case = run cost
                    + hand-back rate × human cost per case
                    + silent-failure rate × cost of an error
                    + unsafe-action rate × loss per unsafe action
                    + gate rate × approver cost
realized value per case = human cost per case − agent cost per case
Part 2's cost per successful task already counts the failed runs you pay for. This formula goes one step further and prices what each failure does after the run. A hand-back costs a person's time. A silent failure costs whatever it takes to find and fix. An unsafe action costs whatever it breaks.
A real case: customer service
Customer service is where agents have the longest public record. Vendors publish prices per resolution and average resolution rates, and one company has reported its results quarter by quarter for over two years. Outcome pricing is spreading: Salesforce launched a pay-per-resolution help agent in June 2026, the same month it agreed to buy Fin, the company formerly called Intercom, for about $3.6 billion (Salesforce, Jun 2026; CMSWire, Jun 2026). Part 1's matrix rates a support agent that issues refunds as reliability first, then controllability. The record bears that out.
What Klarna reported
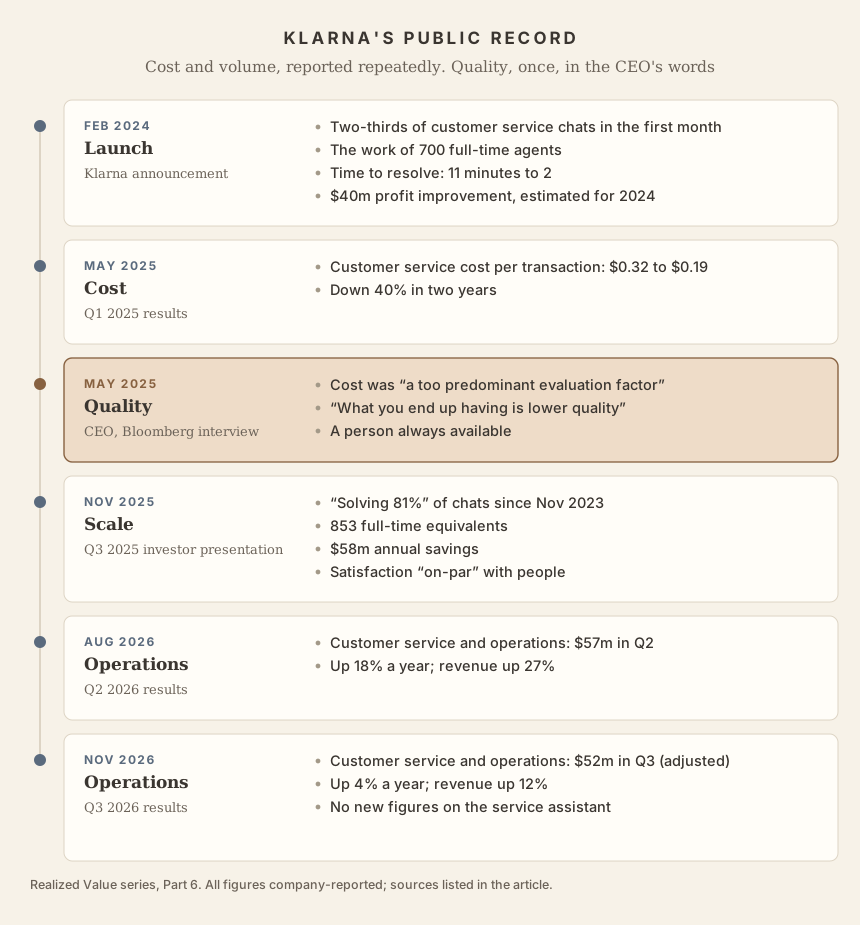
Klarna launched its AI assistant, built with OpenAI, in February 2024. It handles customer service in the Klarna app, including refunds and returns (Klarna F-1, 2025). Its public numbers since then:
| When | What Klarna reported | Source |
|---|---|---|
| Feb 2024 | Two-thirds of customer service chats in the first month. The work of 700 full-time agents. Time to resolve down from 11 minutes to 2. Satisfaction steady. An estimated $40 million profit improvement in 2024 | Klarna announcement (CX Today) |
| May 2025 | Customer service cost per transaction down 40% in two years, from $0.32 (Q1 2023) to $0.19 (Q1 2025) | Q1 2025 results (CX Dive) |
| May 2025 | The CEO said cost had been "a too predominant evaluation factor", and "what you end up having is lower quality". Customers will always be able to reach a person | Bloomberg interview (Fortune) |
| Nov 2025 | "Solving 81%" of chats since November 2023. The equivalent of 853 full-time agents. $58 million of annual savings (Oct 2024 to Sep 2025). Satisfaction "on-par" with human agents. Employees down from 5,527 (2022) to 2,907 | Q3 2025 investor presentation (SEC) |
| Aug 2026 | Customer service and operations costs of $57 million in Q2, up 18% year on year, while revenue grew 27% | Q2 2026 results |
| Nov 2026 | Customer service and operations costs of $52 million in Q3 on Klarna's adjusted basis, up 4% year on year, while revenue grew 12%. Under IFRS the line is $54 million. No new figures on the customer service assistant: no share of chats, no savings and no satisfaction measure | Q3 2026 results (SEC) |
Two outside readings add detail. An engineer who tested the assistant in its launch week found it strong on repeated, simple questions and quick to hand anything complex to a person. In 15 minutes of probing he could not get it to state anything false, though other users got it to write code through prompt injection. He also read the 700 figure as a count of seats. Covering every hour of the day takes about three people per seat (Pragmatic Engineer, 2024).
Read through the framework, the record is uneven. Capability and cost are reported carefully: the share of chats, the cost per transaction, the savings. Reliability appears only as satisfaction. No public number gives the share of "solved" chats that were wrong, and the wording itself moved from "handled" to "solving". The one public statement about quality is the CEO's, fifteen months in. The November 2026 results add a cost line and no figure for the assistant. The design visible from outside is the one this series recommends: a narrow set of topics, and a fast hand-back to a person.
Pricing one conversation
Klarna's numbers give the outcome but not the inputs per conversation. Published vendor prices and rates do, for any team buying an agent today.
| Input | Value | Source | Status |
|---|---|---|---|
| Human cost per live contact | $8.01, the average across phone, chat and email | Gartner, Sep 2019 | Reported; seven years old |
| Agent price | $0.99 per resolution, charged only when resolved | Fin (formerly Intercom) | Published list price, checked 1 Nov 2026 |
| Resolution rate, vendor average | 76% across 12,000 customers | Fin, Mar 2026; repeated by Salesforce, Jun 2026 | Vendor-reported |
| Resolution rate, one deployment | 50.8% (Anthropic's own support) | Fin, Mar 2026 | Vendor-reported |
| What counts as resolved | The customer confirms, or leaves without asking for more help | Fin | Published definition |
| Silent-failure rate | – | No source found | Unreported |
| Cost of a silent failure | From one repeat contact ($8.01) to C$812.02 ordered by a tribunal for one wrong answer | Gartner; Moffatt v. Air Canada, 2024 | Reported range |
With outcome pricing, a failed attempt costs the buyer nothing extra: the vendor is unpaid, and the case goes to a person at the usual cost. So the cost model reduces to two terms.
saving per conversation = resolution rate × (human cost − price per resolution)
                        − silent-failure rate × cost of a silent failure
With no silent failures, the saving is $5.34 a conversation at Fin's 76% average, two-thirds of the human cost. At Anthropic's 50.8% it is $3.57.
The number the record leaves out
The second term is the one the public record leaves blank. The nearest figure I found is Salesforce's CEO estimating the accuracy of the agent on its own help site "in the 90% range". Salesforce has cut its support headcount from about 9,000 to about 5,000 (CX Dive, Sep 2025). Some of the remaining errors reach a person. How many end silently is unreported.
The cost of a silent failure has a reported range. At the low end, the customer comes back, and the business pays for a live contact it thought it had saved. At the high end is Air Canada. Its chatbot told a passenger he could claim a bereavement fare after travel. The policy said otherwise. The tribunal ordered C$812.02 (C$650.88 in damages, plus interest and fees), about US$600, and rejected Air Canada's argument that it was not liable for what its chatbot said: "It should be obvious to Air Canada that it is responsible for all the information on its website" (Moffatt v. Air Canada, 2024 BCCRT 149, para. 27). Air Canada's own legal costs and the press coverage come on top.
Saving per conversation, by resolution rate and silent-failure assumption:
| Resolution rate | No silent failures | 5% silent, each a repeat contact | 1% silent, each costing US$600 |
|---|---|---|---|
| 76% (vendor average) | $5.34 | $4.94 | −$0.66 |
| 50.8% (one deployment) | $3.57 | $3.17 | −$2.43 |
At US$600 a failure, the whole saving is gone when 0.9% of conversations fail silently at the 76% rate, and 0.6% at the 50.8% rate.
What the case shows
The agent's fee is the smallest line. At a 76% resolution rate, fees come to $0.75 a conversation. Hand-backs cost $1.92, two and a half times as much. Ten points of resolution rate are worth $0.70 a conversation, nearly the whole fee. Klarna's own headline metric was cost per transaction, and it fell 40%. For teams that build their own agent, the run cost changes more with the effort setting than with the model. On FrontierCode 2.0, a coding benchmark run by Cognition, Fable 5.2 scored 49.1% at extra-high effort for $14.19 a task and 45.7% at max for $44.70 (Anthropic, 2026).
The market prices a single-try number. A resolution counts when the customer stops asking. That number includes some silent failures, and Part 3's three outcomes cannot be read from it. Lab results show the size of the effect. On a legal-agent benchmark in Anthropic's November system card, Claude Fable 5.2 passed 10.8% of tasks, and 7.2% once any hallucination failed the task: a third of its passes carried an invented claim (Anthropic, 2026). Outcome pricing moves the cost of a failed attempt to the vendor. The cost of a silent failure stays with the buyer, as Air Canada learned.
The rare, costly failures decide. Most silent failures cost a repeat contact, and the saving remains. A few cost far more, and under 1% of those erases the saving. The lever is scope. Keep answers about policy, refunds and legal terms inside retrieved, checked text, and send them to a person when the check fails (Part 4; Part 5). Klarna's narrow topic set is one visible example.
Quality shows up late. Klarna's cost numbers improved for over a year before its CEO said quality had suffered. The number that tracks quality is the silent-failure rate, measured by sampling "resolved" conversations and checking them against the record. None of the public sources reports it.
From saving to return: the organisation
The per-conversation saving prices the agent. The introduction puts the organisation one level up, and the return depends on it:
return = volume × saving per case
       + value of redeployed time
       − fixed costs
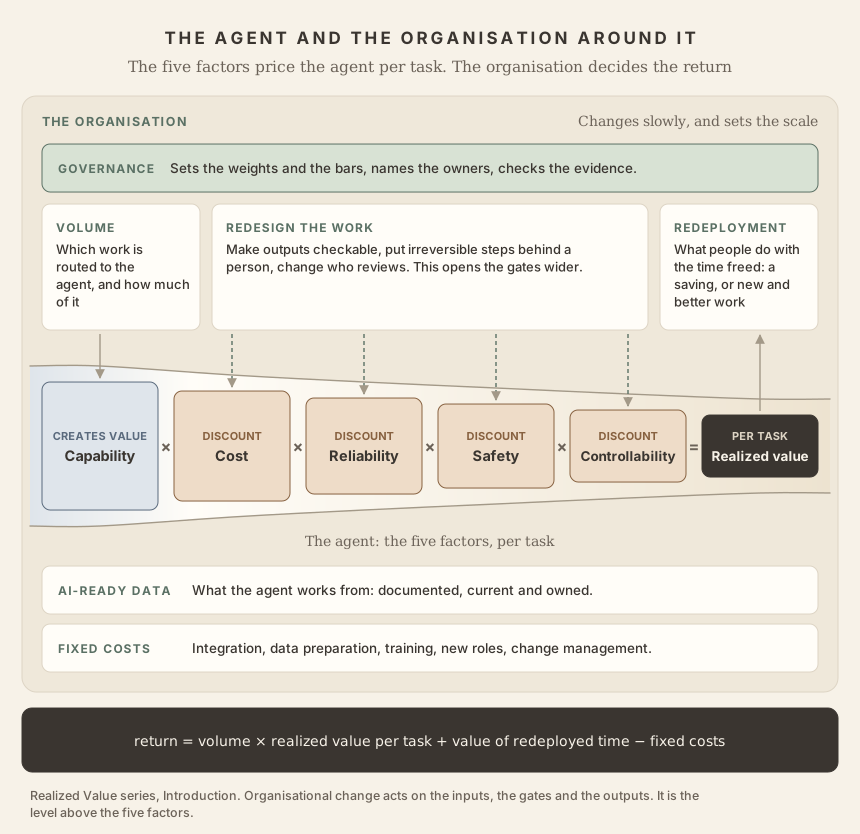
Volume. Which work is routed to the agent, and how much of it. Klarna's assistant took two-thirds of chats in its first month. Volume also sets the break-even point. The fixed costs stay the same whatever the volume: integration with order, payment and identity systems, preparing and documenting the data the agent reads, the golden set and its graders, the controls, the drills and the monitoring, and a named owner. None of the public cases above reports them. So compute the break-even volume before the pilot: fixed monthly cost divided by saving per conversation. At $5.34 a conversation, each $10,000 a month of evaluation, monitoring and ownership needs about 1,900 conversations a month. At $3.57, about 2,800. The build cost comes on top, and pays back from what is left.
Redesign. Changing the work so the four discounts are smaller. In customer service, that means answers about policy, refunds and legal terms come from retrieved, checked text, and a fast hand-back sends the rest to a person. The text has to be current: in one peer-reviewed test, outdated passages in a source did more harm than having no relevant passage (Ouyang et al., 2025). Redesign raises the resolution rate and reduces the rare, costly failures. Klarna's narrow topic set is redesign of this kind.
Redeployment. What people do with the time freed. The cost model above prices automation: a human contact avoided. Klarna took that saving, then its CEO put a person back within reach of every customer. Sayash Kapoor, Rishi Bommasani and Arvind Narayanan argue that the larger gains come from augmentation, and that automation without structural change is limited in what it can deliver (STABL, 2026). Augmentation needs a different baseline: the value of the work, as METR's survey measures it, where the cost model counts the cost of a contact. Count it separately, and say how it was estimated.
Greenfield. A company built around agents from the start has no human contact to avoid. Its saving per case becomes a margin: the price a customer pays, minus the agent cost per case. The same lines apply. Run cost shows in gross margin, which averaged 45% on AI products in 2025 (ICONIQ, 2026, a survey of about 300 software companies). Hand-backs show as the people the company still needs: almost half of those companies say their agents need a person on at least 30% of tasks, and Crosby, an AI-native law firm, says its lawyers still review every work output (Artificial Lawyer, 2026). Silent failures and unsafe actions show as liability, which stays with the company. Crosby plans professional liability insurance for its agents. Volume and fixed costs work as before, with one difference: the golden set, the controls and the audit trail are built from nothing. The introduction sets out the wider case.
The saving per conversation depends on the silent-failure rate. A team that does not measure that rate does not know its break-even volume, and it cannot tell whether the time it freed went into better work or into cleaning up.
Four ways to use it in a programme
1. Choose use cases by their weakest factor. Score each candidate on Part 1's five attributes: stakes, autonomy, reversibility, integration complexity and verifiability. Start where the weakest factor is cheap to raise: reversible, verifiable, few systems, high volume. Hold work that is irreversible and hard to verify until the controls exist. Part 1's matrix gives five worked cases. Cost is the first constraint for a meeting summariser, the capability ceiling for a coding agent, reliability for refunds, safety for a patient-chart summariser and controllability for a trading agent.
2. Spend on the factor nearest zero. This is the multiplication, turned into a budget rule. In the customer-service case, ten points of resolution rate are worth $0.70 a conversation. Cutting the agent's price to zero would save $0.75. Money spent on a factor that is already high changes the result very little.
3. Write the kill criteria before the pilot. Agree the thresholds in advance: passk at the tier's k (Part 3), a maximum silent-failure rate from audited samples, a maximum cost per successful task, a maximum severity-weighted unsafe-action rate, and the break-even volume. Write beside each what happens if it is missed: fix it, narrow the scope, or stop. Gartner found 31% of organisations had guidelines like these for pilots. A pilot measured against Gartner's three reasons for cancellation finds out early and cheaply whether it will be one of the 40%.
4. Buy against the three-clause contract. Part 5 set out three clauses: measurement (passk on your tasks, with the hand-back and silent-failure rates), behaviour (the unsafe-action and intervention rates) and bounds (bounded share, bound-leak rate, time-to-halt, gate load). A vendor's resolution rate becomes checkable when it arrives with all three, measured on your own conversations. Add one question to the bounds clause: which model answers when the vendor's safeguards block a request? In Anthropic's tests, a fallback to an older model served 53% of injection attacks on Fable 5.2 and was easier to hijack. On its API the fallback is opt-in (Anthropic, 2026).
Building it: one sequence
Each part ended with its own order of operations. Merged, they give one sequence of ten steps. The first four decide whether to build at all, and they cost the least.
- Frame. Write down the use case and rate it on Part 1's five attributes. List every action, tier each one (Part 4), and set a reliability bar per tier (Part 3).
- Baseline. Measure the human process: cost, time and error rate per case. Without a baseline there is no return to report.
- Golden set. Build it from real cases. Poor data shows here first: note each case that fails because the source is out of date, duplicated or undocumented, and fix the source before tuning the agent (introduction). Check the graders against people on true positive and true negative rates (Part 3).
- Ceiling. Measure capability under generous conditions. If the ceiling is below what the task needs, stop here (Part 1).
- Realise. Engineer the weakest layer first, often the harness or the context. Then pick the cheapest model that meets the bar (Part 1).
- Cost. Instrument cost per step and success rate. Decide workflow or agent. Then work through caching, effort settings, context budgets, routing and deflection (Part 2).
- Reliability. Run every task k times. Items that never pass go back to step 5. Items that pass some of the time are reliability work. Design for hand-backs, so failures arrive labelled (Part 3).
- Behaviour. State the scope. Verify consent before high-tier actions. Check the agent's claims against its trace (Part 4).
- Bounds. Least privilege, caps inside tools, gates where reversibility ends, a drilled halt, traces that raise alerts, and a harness that still works after a model change (Part 5).
- Launch narrow, then widen. Shadow mode first, then the lowest tier. Widen the volume as the scorecard holds, and decide what the freed time goes to. Re-run the whole suite on every model, harness or tool change.
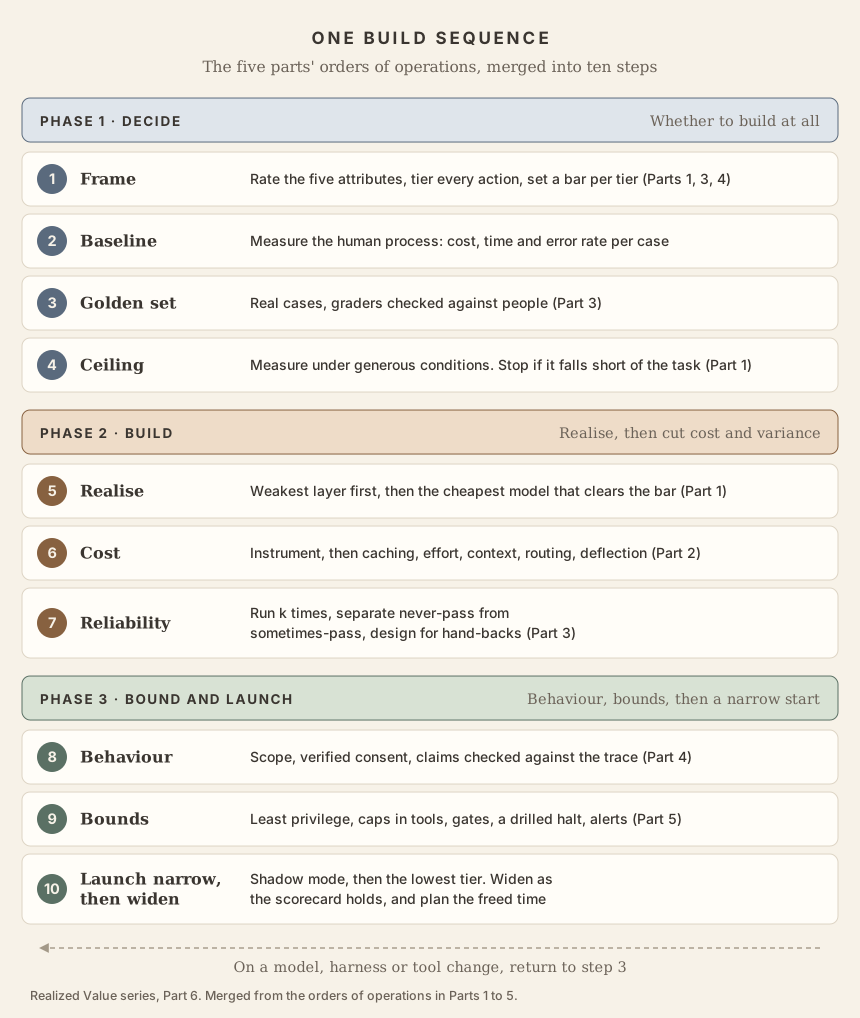
Klarna's public numbers cover step 2 (a cost per transaction from before the assistant) and step 6. The quality its CEO pointed to belongs to step 7.
One scorecard
Twelve numbers carry the whole case: ten for the agent and two for the organisation. Engineering, finance and risk can read the same sheet, because each number feeds a line of the business case.
| # | Number | Factor | Business-case line it feeds |
|---|---|---|---|
| 1 | Cost per successful task | Cost (Part 2) | Run cost |
| 2 | passk, with its interval | Reliability (Part 3) | How far the reliability lines can be trusted |
| 3 | Hand-back rate | Reliability | People's time |
| 4 | Silent-failure rate | Reliability | Rework, refunds, complaints |
| 5 | Severity-weighted unsafe-action rate, at its intervention rate | Safety (Part 4) | Expected loss |
| 6 | Bounded share | Controllability (Part 5) | Share of the risk with a cap |
| 7 | Bound-leak rate | Controllability | Whether the cap holds |
| 8 | Time-to-halt | Controllability | Size of the worst day |
| 9 | Gate load | Controllability | Approver time, and whether the gates still work |
| 10 | Realized value per case | All five | Saving per case |
| 11 | Volume routed to the agent | Organisation | Scale of the saving, and the break-even point |
| 12 | Return per month | Organisation | Volume × saving + redeployed value − fixed costs |
The scorecard is the governance instrument. Governance sets a threshold beside each number before the first run, with the action if it is missed, and names an owner for each. After launch, report the twelve together, every month and after every change of model, harness or tool. The public customer-service record covers three of the twelve: cost, the resolution rate behind the hand-back rate, and volume. The return appears only as Klarna's annual savings estimate.
A blank copy of the scorecard, a worksheet for the cost model and the ten-step sequence as a checklist are in the companion repository.
Where the arithmetic stops
Cost and reliability convert to money cleanly. Runs, hand-backs and rework can be counted. The silent-failure rate has to be measured by audit, and it is the input that changes the answer most.
Safety converts as expected loss, and the loss per unsafe action is a judgement call. Write down who made it, and on what evidence. Tribunal awards and refunds give a floor. Lab safety numbers are a best case: in UK AISI's tests, Anthropic's newest model considered it might be in an alignment evaluation in 96% of runs (Anthropic, 2026).
Controllability converts worst. Its main value is the cap on the worst day, and an average hides the worst day. Report the largest loss a single conversation can cause, with and without the bounds, beside the expected value. An agent that can only quote retrieved policy has a smaller worst day than one that can state policy in its own words.
The ceiling changes. On Terminal-Bench 4.0, the September 2026 models gained 2 to 54 points over their predecessors (Part 1). A business case written against one model generation needs re-running on the next, and so does the scorecard.
What this means for enterprise programmes
- Price every factor per case, against a measured human baseline.
- Measure the silent-failure rate by audit, because the public record leaves it out.
- Spend on the factor nearest zero, and find it again after every change.
- Count the fixed costs, and compute the break-even volume before the pilot.
- Plan the redeployment. Decide what the freed time goes to, and count its value separately.
- Write the kill criteria before the first run, and run one scorecard for engineering, finance and risk.
The introduction asked how much of a model's capability is left once it reaches production. Parts 1 to 5 gave a way to measure each discount. This part puts a price on each one.
Capability sets the ceiling. The other four decide how much of it you keep. The organisation decides how much of that becomes a return.
- 0Introduction ↗The framework. How the factors multiply.Published
- 1Capability ↗The model sets the ceiling. The system decides how much of it you get.Published
- 2Cost ↗Cost per successful task.Published
- 3Reliability ↗pass@always, and why it lags capability.Published
- 4Safety ↗The agent's behaviour under uncertainty.Published
- 5Controllability ↗The operator's leverage, and where security fits.Published
- 6From framework to ROIThe business case and the build plan.This article
Every input in the customer-service case is reported, with its source and date, except the silent-failure rate, which none of the sources I found publishes. The table shows what it does to the result. Fin's resolution rates and Klarna's savings are company-reported. Gartner's cost per contact dates from 2019 and averages phone, chat and email. The US dollar value of the Air Canada award uses the exchange rate at the time of the decision. The Fable 5.2 figures are vendor-reported, from Anthropic's system card. Klarna's Q3 2026 results, published on 17 November, are in the table. The units, levers and contract clauses are defined in Parts 1 to 5.
References
- Gartner. Gartner Survey Finds Only 13% of CIOs Say Their Enterprise Has Realized Significant or Transformational Value from AI (19 Oct 2026). 2,002 CIOs; 31% have guidelines for stopping pilots before production, 17% for abandoning low-value AI in production.
- Gartner. Gartner Predicts Over 40% of Agentic AI Projects Will Be Canceled by End of 2027 (25 Jun 2025). Escalating costs, unclear business value, inadequate risk controls.
- Gartner. Gartner Says Only 9% of Customers Report Solving Their Issues Completely via Self-Service (25 Sep 2019). Live channels average $8.01 per contact; self-service about $0.10.
- Klarna Group plc. Form F-1/A (SEC, 2025). AI assistant launched February 2024; customer service including refunds and returns.
- CX Today. Klarna claims its new AI assistant does the work of 700 full-time agents (29 Feb 2024).
- CX Dive. Klarna credits AI for slashing customer service costs (21 May 2025), from Klarna's Q1 2025 results. $0.32 to $0.19 per transaction.
- Fortune. As Klarna flips from AI-first to hiring people again, a new landmark survey reveals most AI projects fail to deliver (9 May 2025), reporting a Bloomberg interview with Sebastian Siemiatkowski.
- Klarna Group plc. Q3 2025 investor presentation (SEC Form 6-K, Nov 2025). 81% of chats, 853 full-time equivalents, $58 million annual savings, headcount.
- Klarna Group plc. Q2 2026 earnings release (Aug 2026). Customer service and operations costs; revenue.
- Klarna Group plc. Q3 2026 earnings release (SEC, 17 Nov 2026). Customer service and operations costs, adjusted and IFRS; revenue.
- Gergely Orosz. Klarna's AI chatbot: how revolutionary is it, really? (The Pragmatic Engineer, newsletter 29 Feb 2024; blog 8 Aug 2024).
- Fin (formerly Intercom). Fin resolutions (help centre). Definition and $0.99 price per resolution.
- Fin. ROI of AI customer service: 2026 benchmarks (19 Mar 2026). 76% average across 12,000 customers; 50.8% for Anthropic (vendor-reported).
- CX Dive. Salesforce still sees a place for live customer service agents after massive cuts (4 Sep 2025). Support headcount about 9,000 to about 5,000; accuracy "in the 90% range".
- Salesforce. Salesforce signs definitive agreement to acquire Fin (15 Jun 2026). About $3.6 billion; more than 30,000 companies; 76% average resolution.
- CMSWire. Salesforce debuts Help Agent with pay-per-resolution AI (25 Jun 2026).
- Ouyang et al. HOH: A Dynamic Benchmark for Evaluating the Impact of Outdated Information on Retrieval-Augmented Generation (ACL 2025; peer-reviewed). 96,124 question-answer pairs.
- Anthropic. System Card: Claude Fable 5.2 & Claude Mythos 5.2 (9 Nov 2026). Vendor-reported. LAB-AA hallucination gate, FrontierCode effort and cost, safeguard fallback and prompt injection, evaluation awareness.
- Sayash Kapoor, Rishi Bommasani and Arvind Narayanan. The missing quadrant in responses to AI (STABL, 11 Nov 2026).
- ICONIQ. 2026 State of AI: The Builder's Economy (Jul 2026). Survey of about 300 executives at software companies building AI products.
- Artificial Lawyer. Crosby to Insure Its Agents for Legal Liability (28 Jul 2026).
- Civil Resolution Tribunal of British Columbia. Moffatt v. Air Canada, 2024 BCCRT 149 (14 Feb 2024). C$812.02 total; para. 27 on responsibility for chatbot information.
- Introduction · Capability · Cost · Reliability · Safety · Controllability
Change log
- 19 Nov 2026 (v11, published). Added data readiness, following the introduction (v20): preparing and documenting data is listed with the fixed costs, the redesign paragraph notes that retrieved text has to be current, and build step 3 says to fix the source data before tuning the agent. Figure 3, shared with the introduction, gains an "AI-ready data" bar. One reference added.
- 18 Nov 2026 (v10, published). Plain-language review. 13 phrases reworded to remove figures of speech, for example "sits", "lands", "moves", "binds", "ships" and "survives" used for where a number is, how it changes, or what is left. The framework's own terms stay: ceiling, floor, binding constraint, discount, lever and bound-leak rate. No figures, claims or sources changed.
- 18 Nov 2026 (v9, published). Added Klarna's Q3 2026 results, published on 17 November: customer service and operations costs of $52 million on the adjusted basis, up 4% on the year, against revenue growth of 12%. The release gives no new figures for the customer service assistant. New row in the table, a sixth card in Figure 1, and the note at the end updated. The cost model and its results are unchanged.
- 15 Nov 2026 (v8, published). Added a link to the companion repository, which holds a blank scorecard, a worksheet for the cost model and the build sequence as a checklist. No figures changed.
- 14 Nov 2026 (v7, published). Review fixes. Gartner's cancellation forecast is dated June 2025 (was "a year earlier"). FrontierCode 2.0 is named, and credited to Cognition, which ran it. The two 13 November change-log entries, both version 6, are merged. Dates are written day first throughout. Klarna's third-quarter results are still to come.
- 13 Nov 2026 (v6, published). Figures redrawn with larger type, for readability. Figures 1, 2 and 4 and the series locator are now drawn 860 wide, so their text is about twice its earlier size on the page. Figure 1 lists Klarna's record as a vertical timeline, Figure 2 moves the line labels to a legend above the chart, and Figure 4 lists the ten steps as rows under their three phases. No data changed. Restored build step 5 to Part 1's order (engineer the weakest layer first, then pick the cheapest model that clears the bar). That fix was first made on 12 Nov and was overwritten by the greenfield update. Earlier the same day, in the same version: named the scorecard as the governance instrument: governance sets the thresholds, names an owner for each number and reviews the sheet. Figure 3 now shows governance, and has larger type, following the introduction.
- 12 Nov 2026 (v5). Added a greenfield paragraph to the organisation section: for a company built around agents, the saving per case becomes a margin, and the same cost lines apply.
- 12 Nov 2026 (v4). Added the introduction's Figure 7 (the agent and the organisation around it) to the section on the organisation, as Figure 3. The build sequence is now Figure 4.
- 12 Nov 2026 (v3, published). Published. Added a series locator at the top: the five factors inside the organisation, with the organisation highlighted. Added a bottom-line box. Replaced the fixed-cost section with "From saving to return: the organisation" (volume and break-even, redesign, redeployment), in line with the introduction's v10. Added Anthropic's Fable 5.2 system card evidence (hallucination-gated passes, effort and cost, the safeguard fallback, evaluation awareness), Salesforce's acquisition of Fin and its pay-per-resolution agent, and STABL's case for augmentation. Scorecard extended to twelve numbers with volume and return. Build step 10 now widens volume and plans redeployment. New closing line. Started this change log.
- 1 Nov 2026 (draft v2). Replaced the illustrative refund agent with a customer-service case built on reported evidence: Klarna's public record, published prices and resolution rates, and the Air Canada tribunal decision. New Figures 1 and 2.
- 1 Nov 2026 (draft v1). First draft: the cost model, a worked example with illustrative numbers, fixed costs and break-even volume, four ways to use the framework, the merged build sequence and the scorecard.